Trade with
Confluence

A professional market dashboard and custom TradingView indicators built for serious traders. Macro scoring, breadth analysis, AI-powered session narratives.

confluencetradingtools.com
Live Dashboard
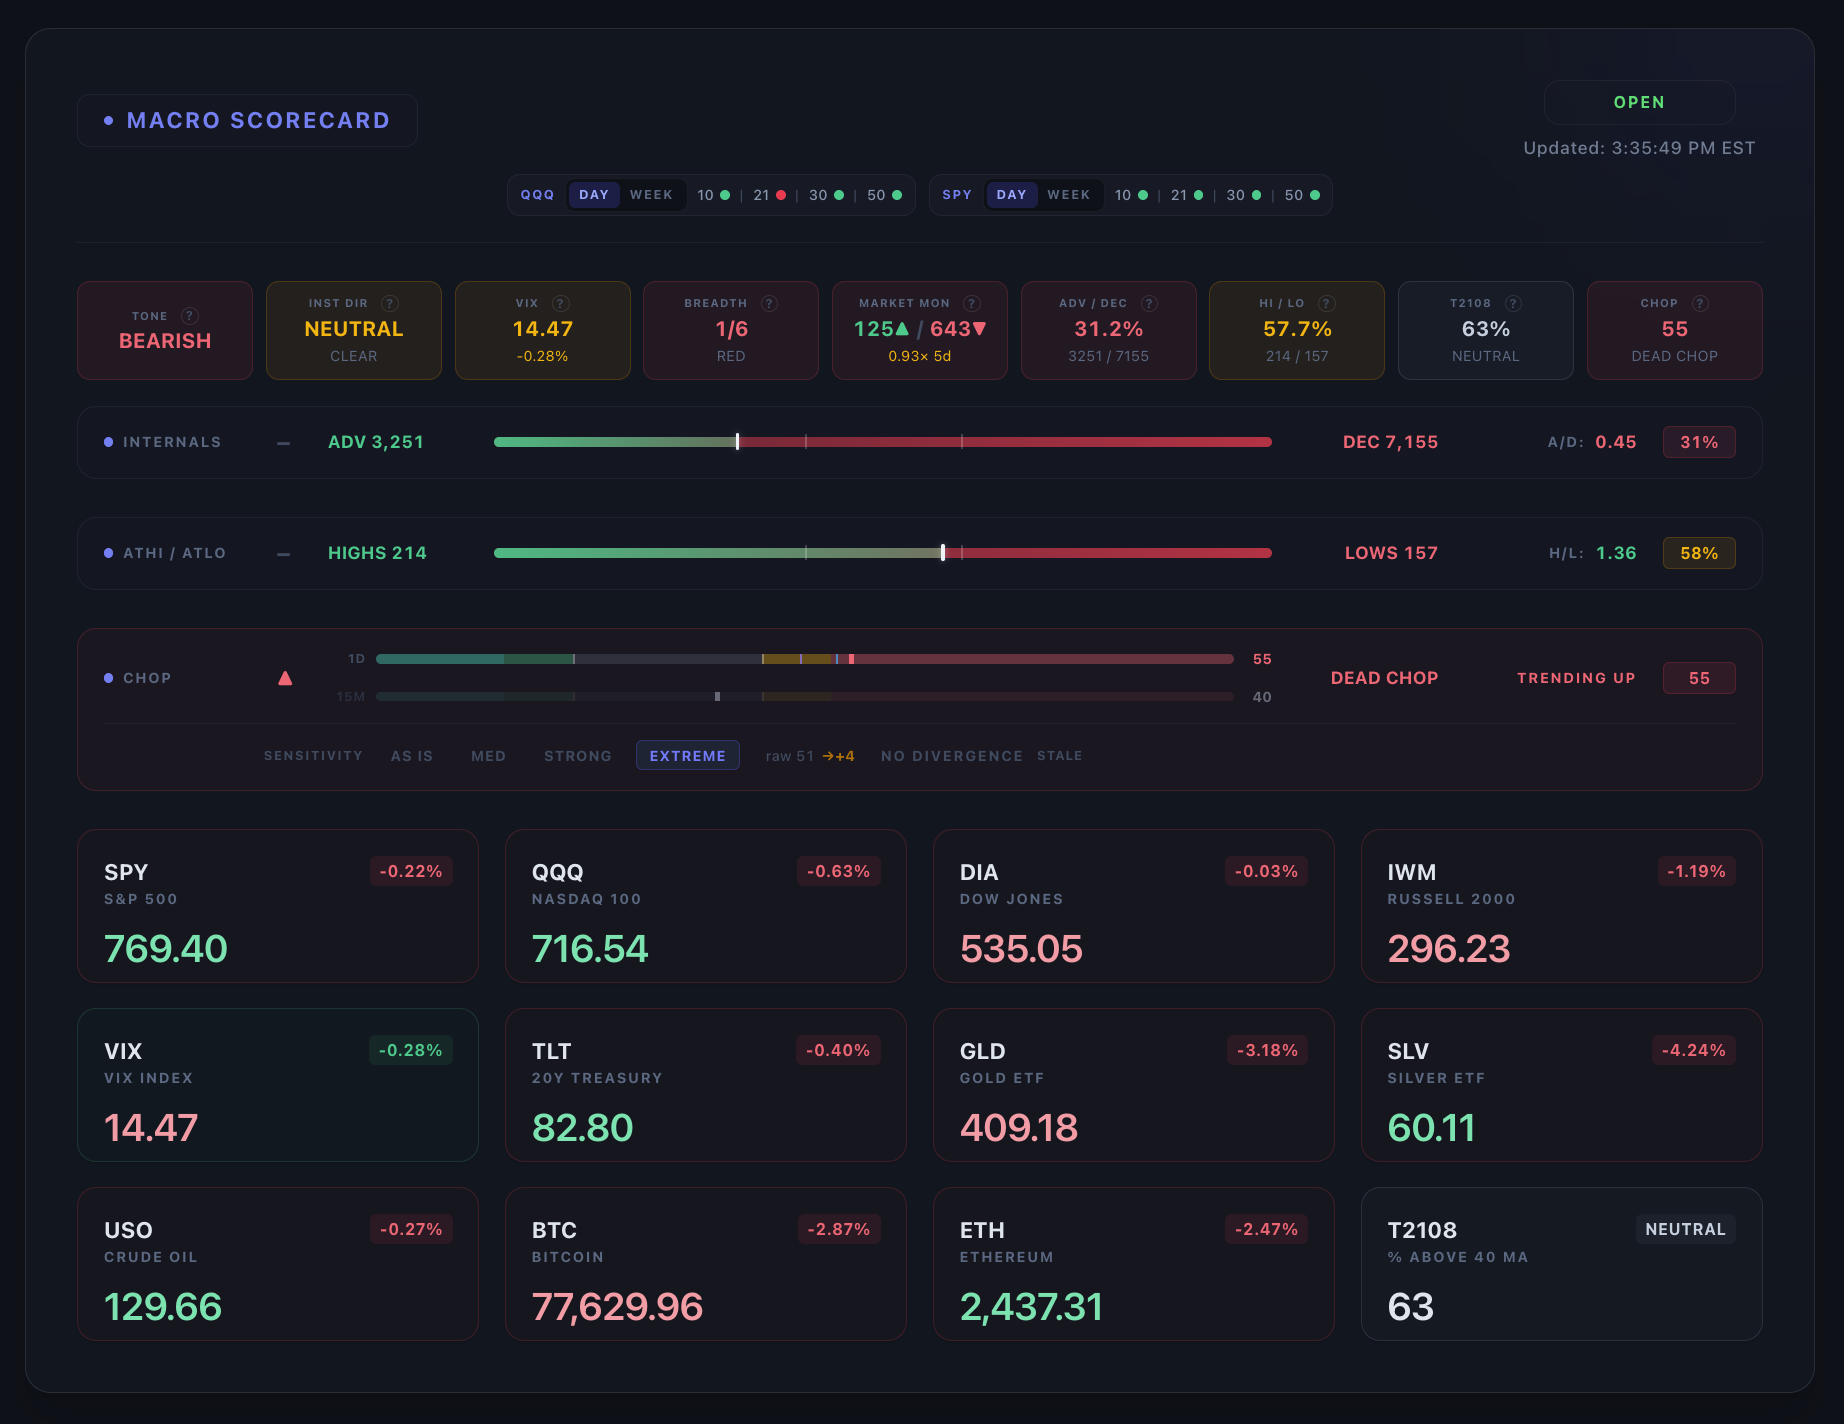
CTT Macro Scorecard — tone, breadth, chop index, internals, and ticker grid
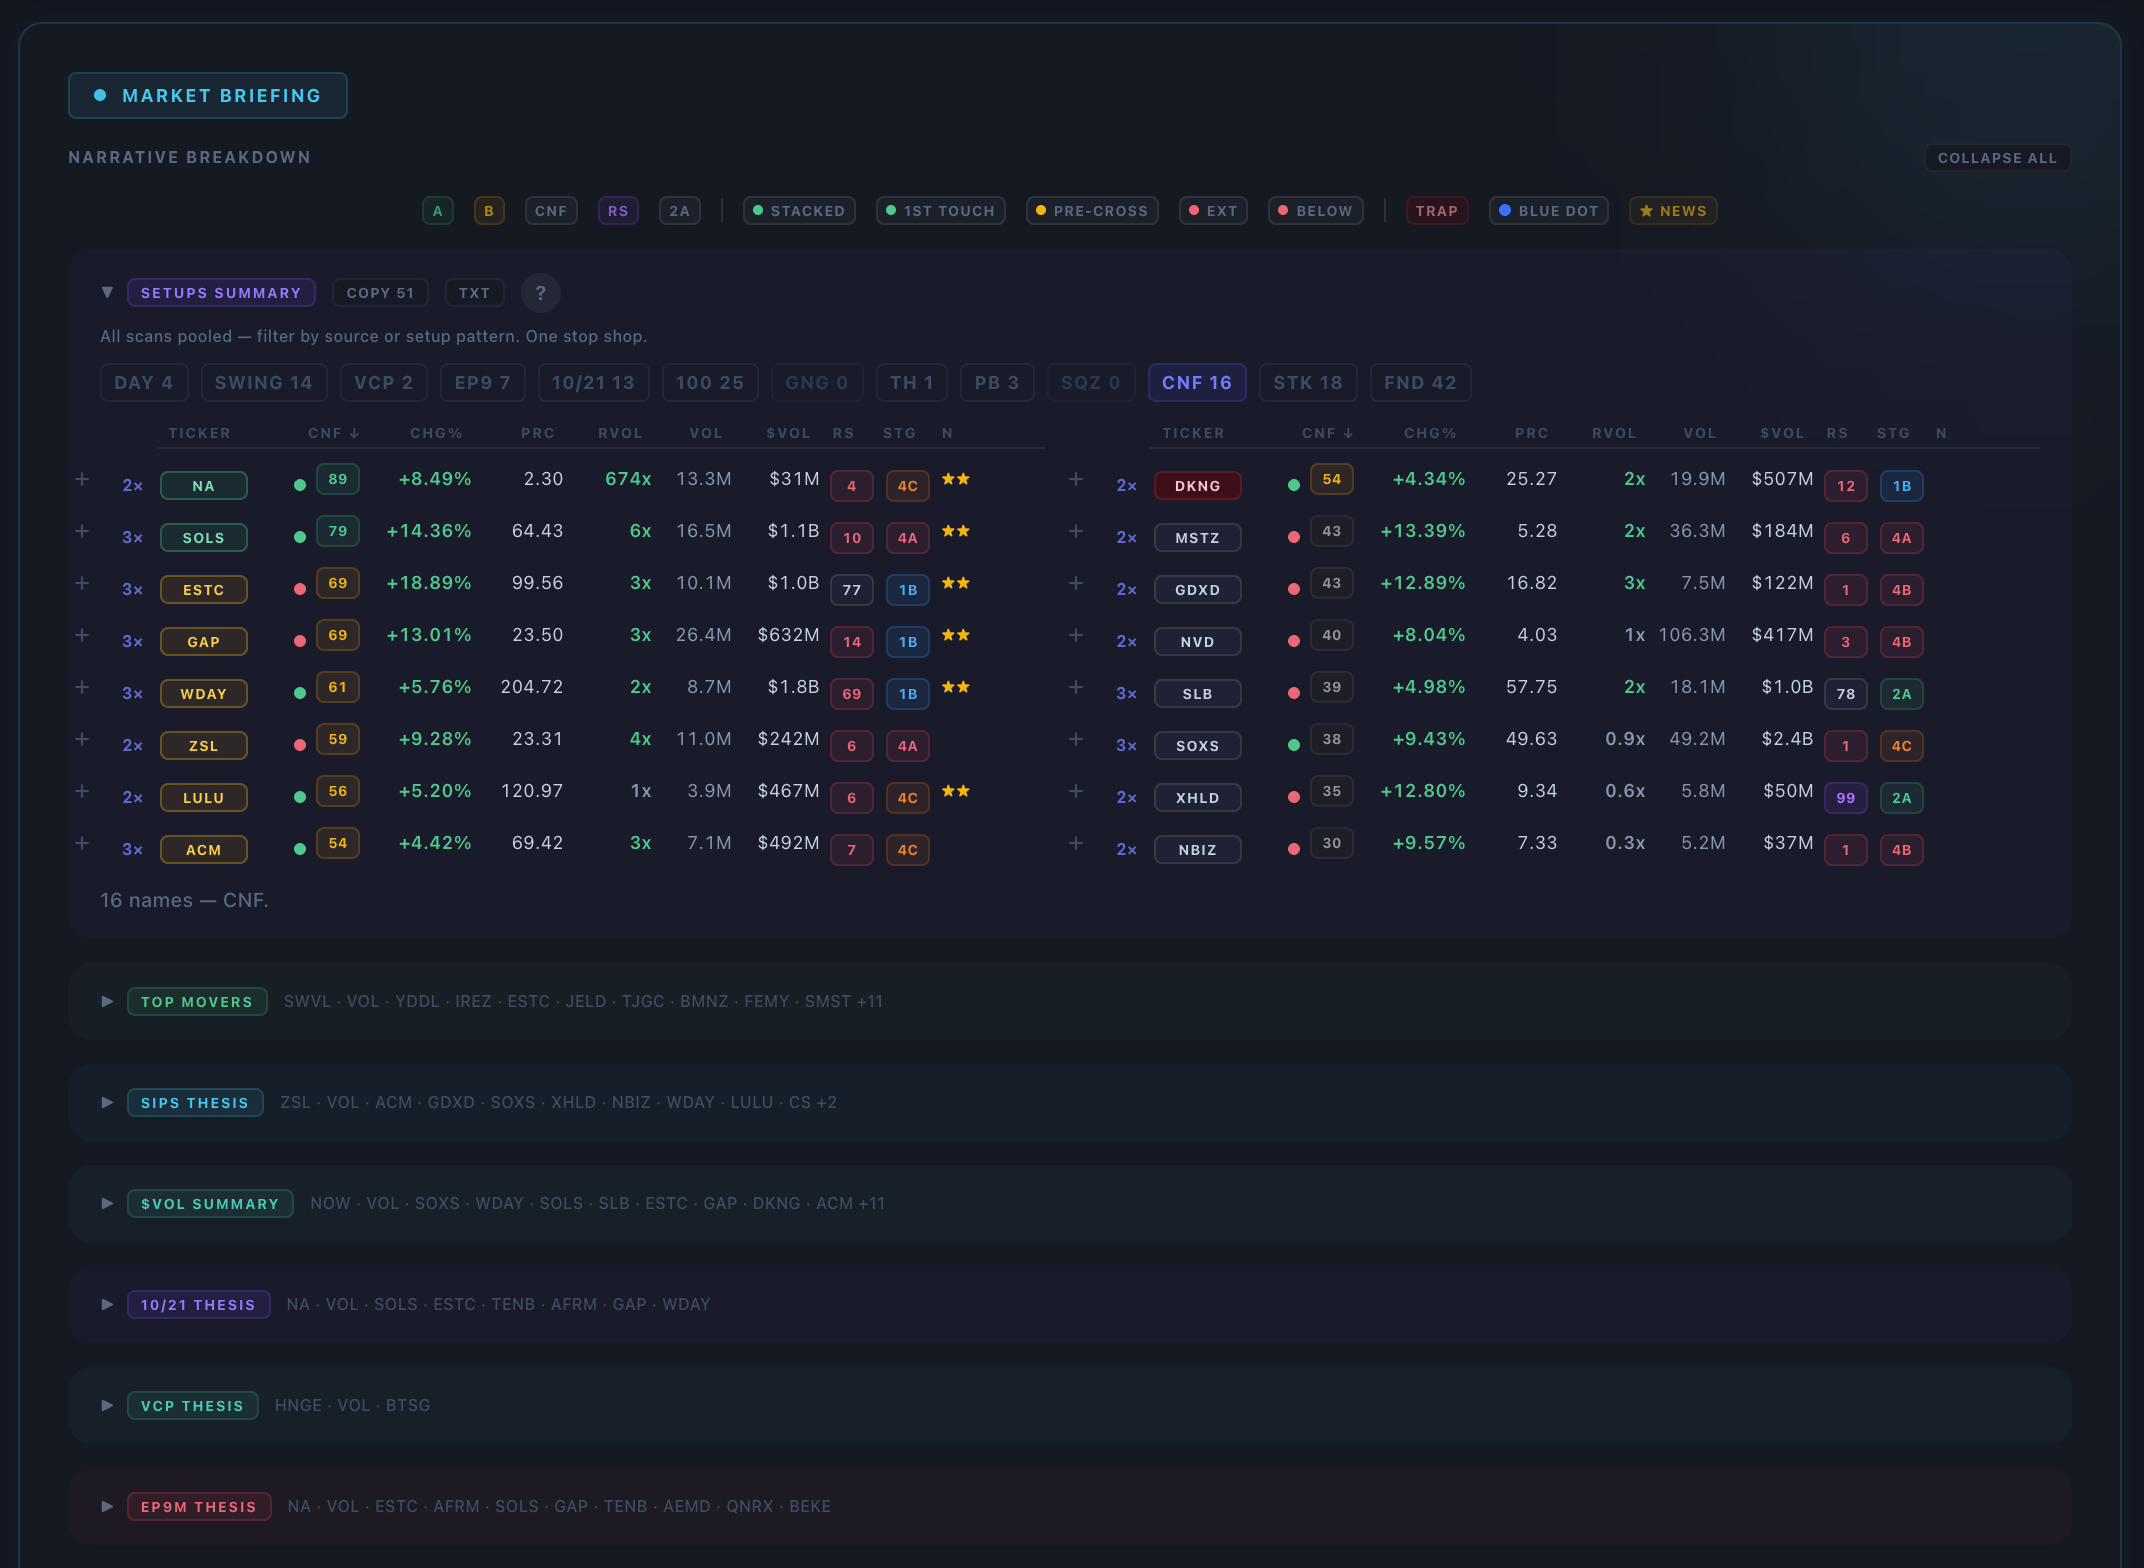
CTT Summary Card — narrative breakdown with setups summary, scanner filters, confluence scoring, and thesis breakdowns
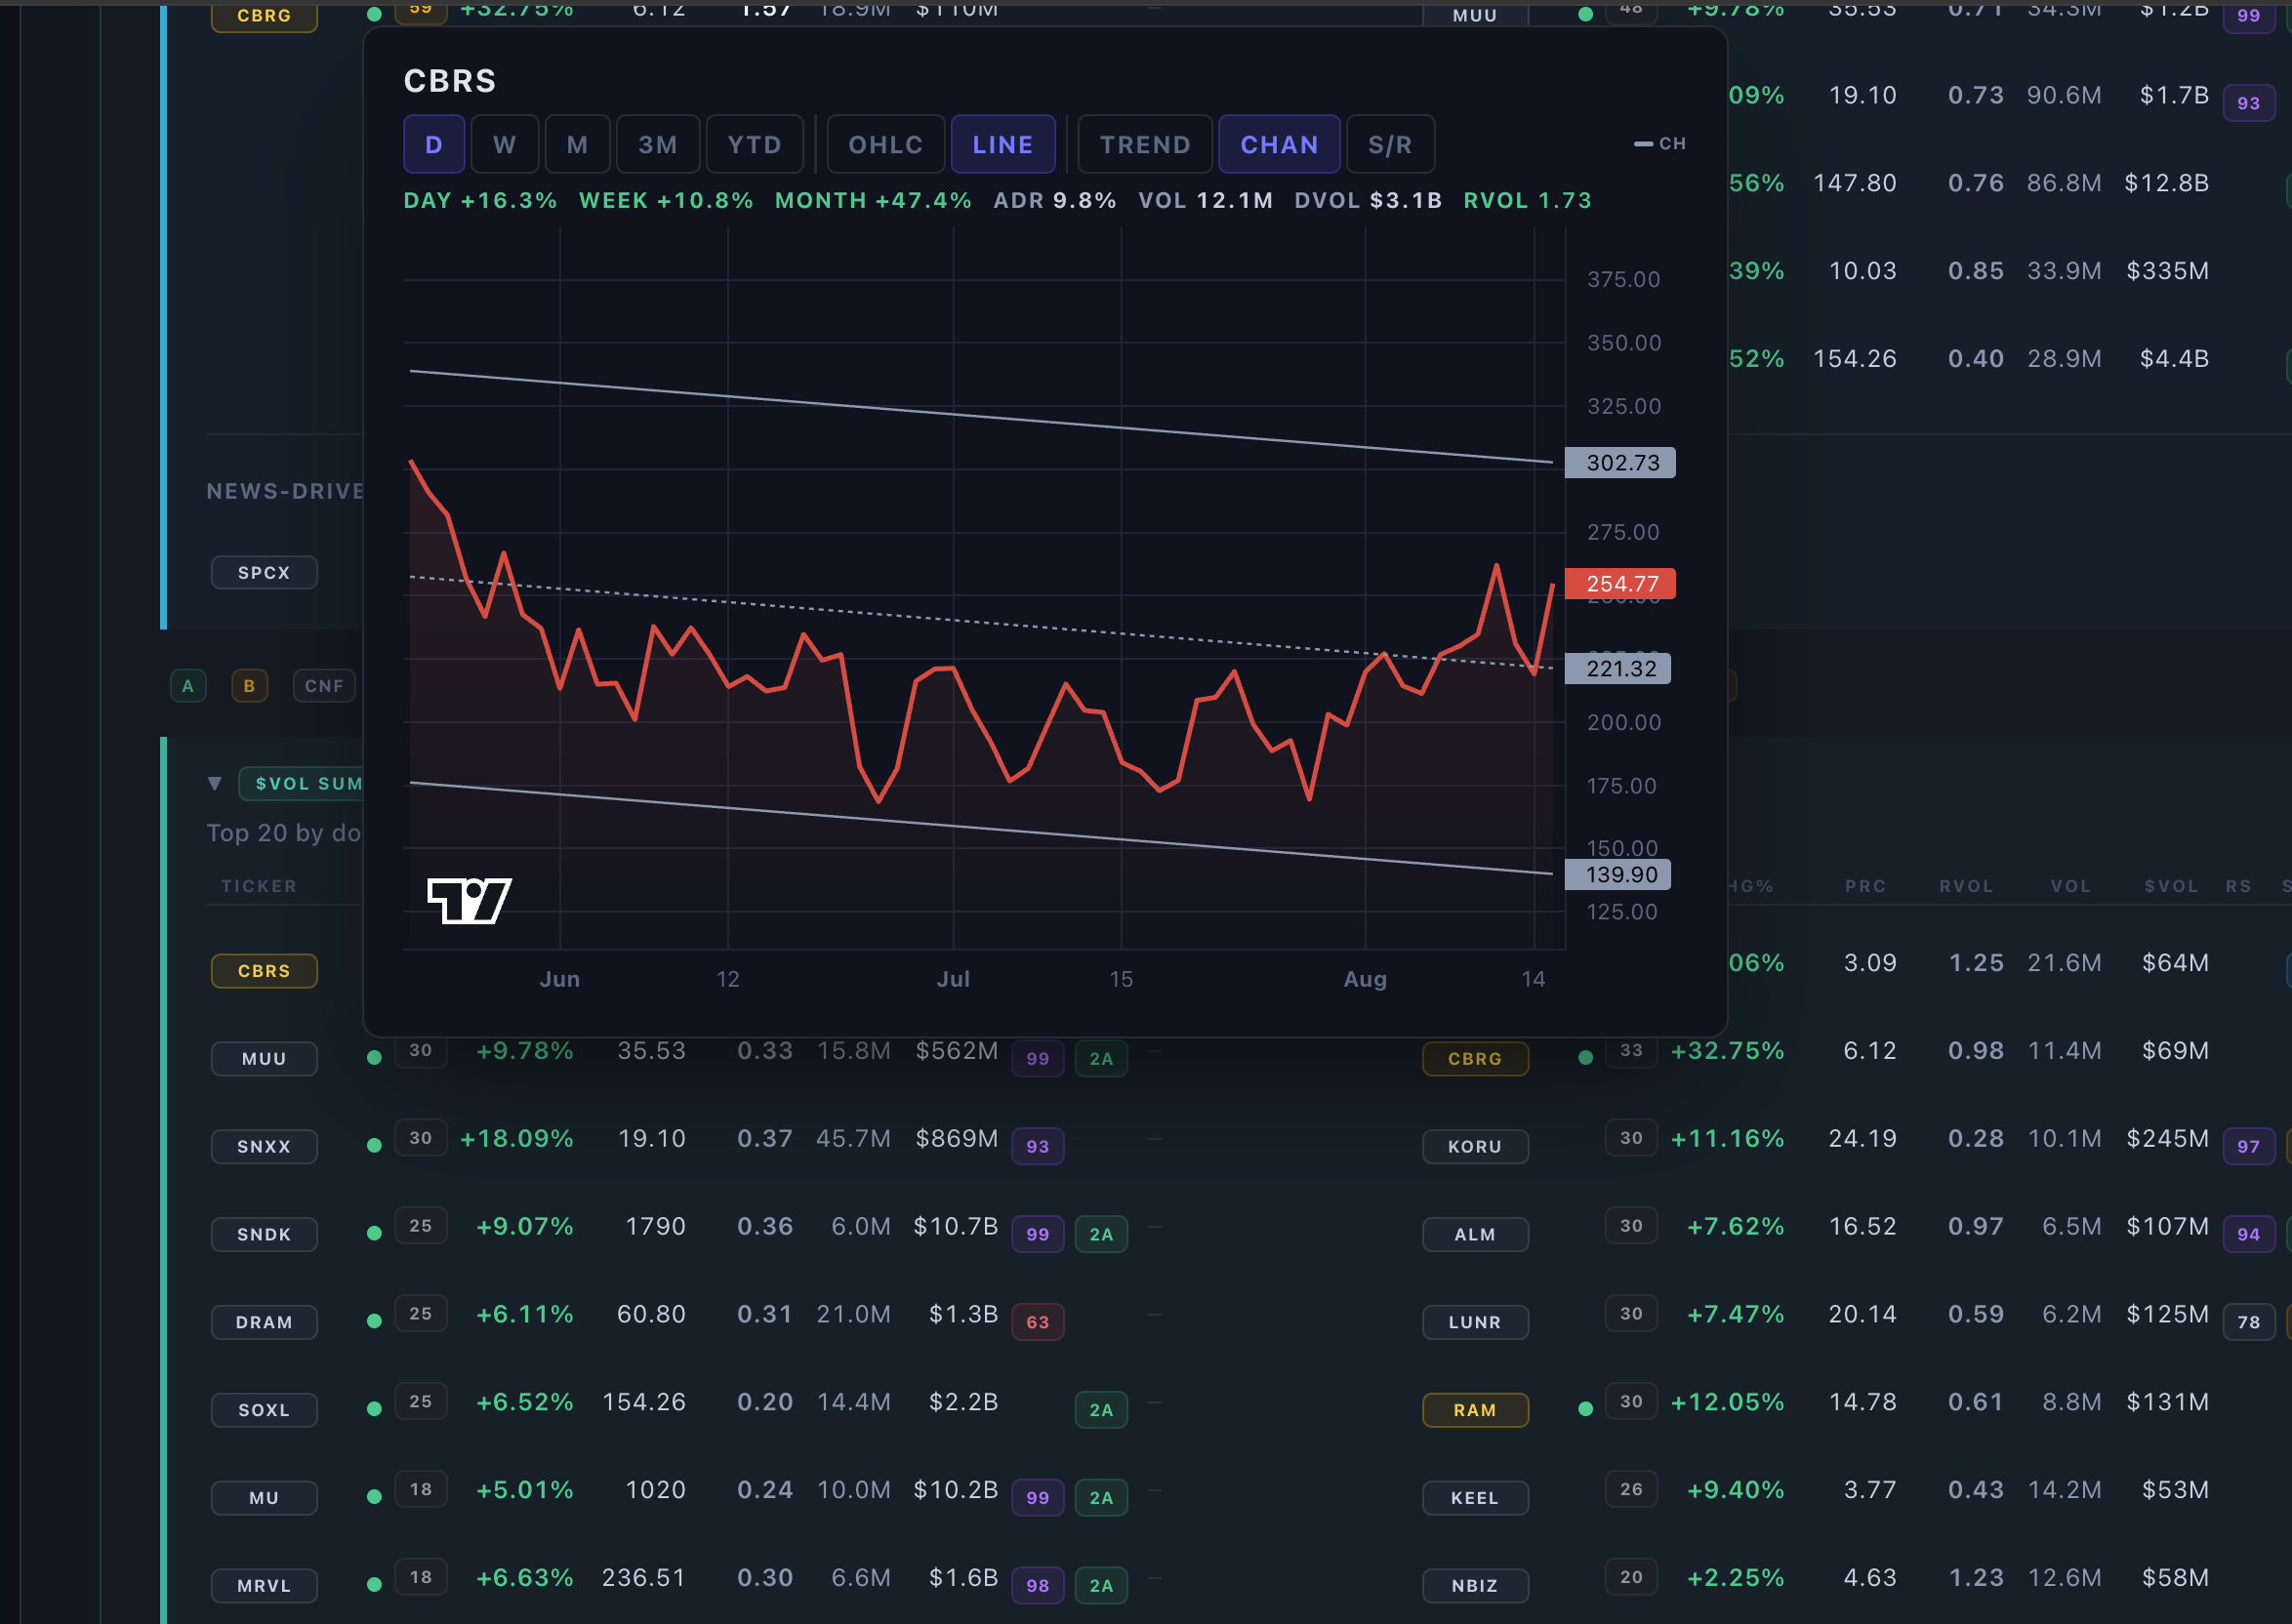
CTT Hover Charts — interactive stock charts with scanner data overlay
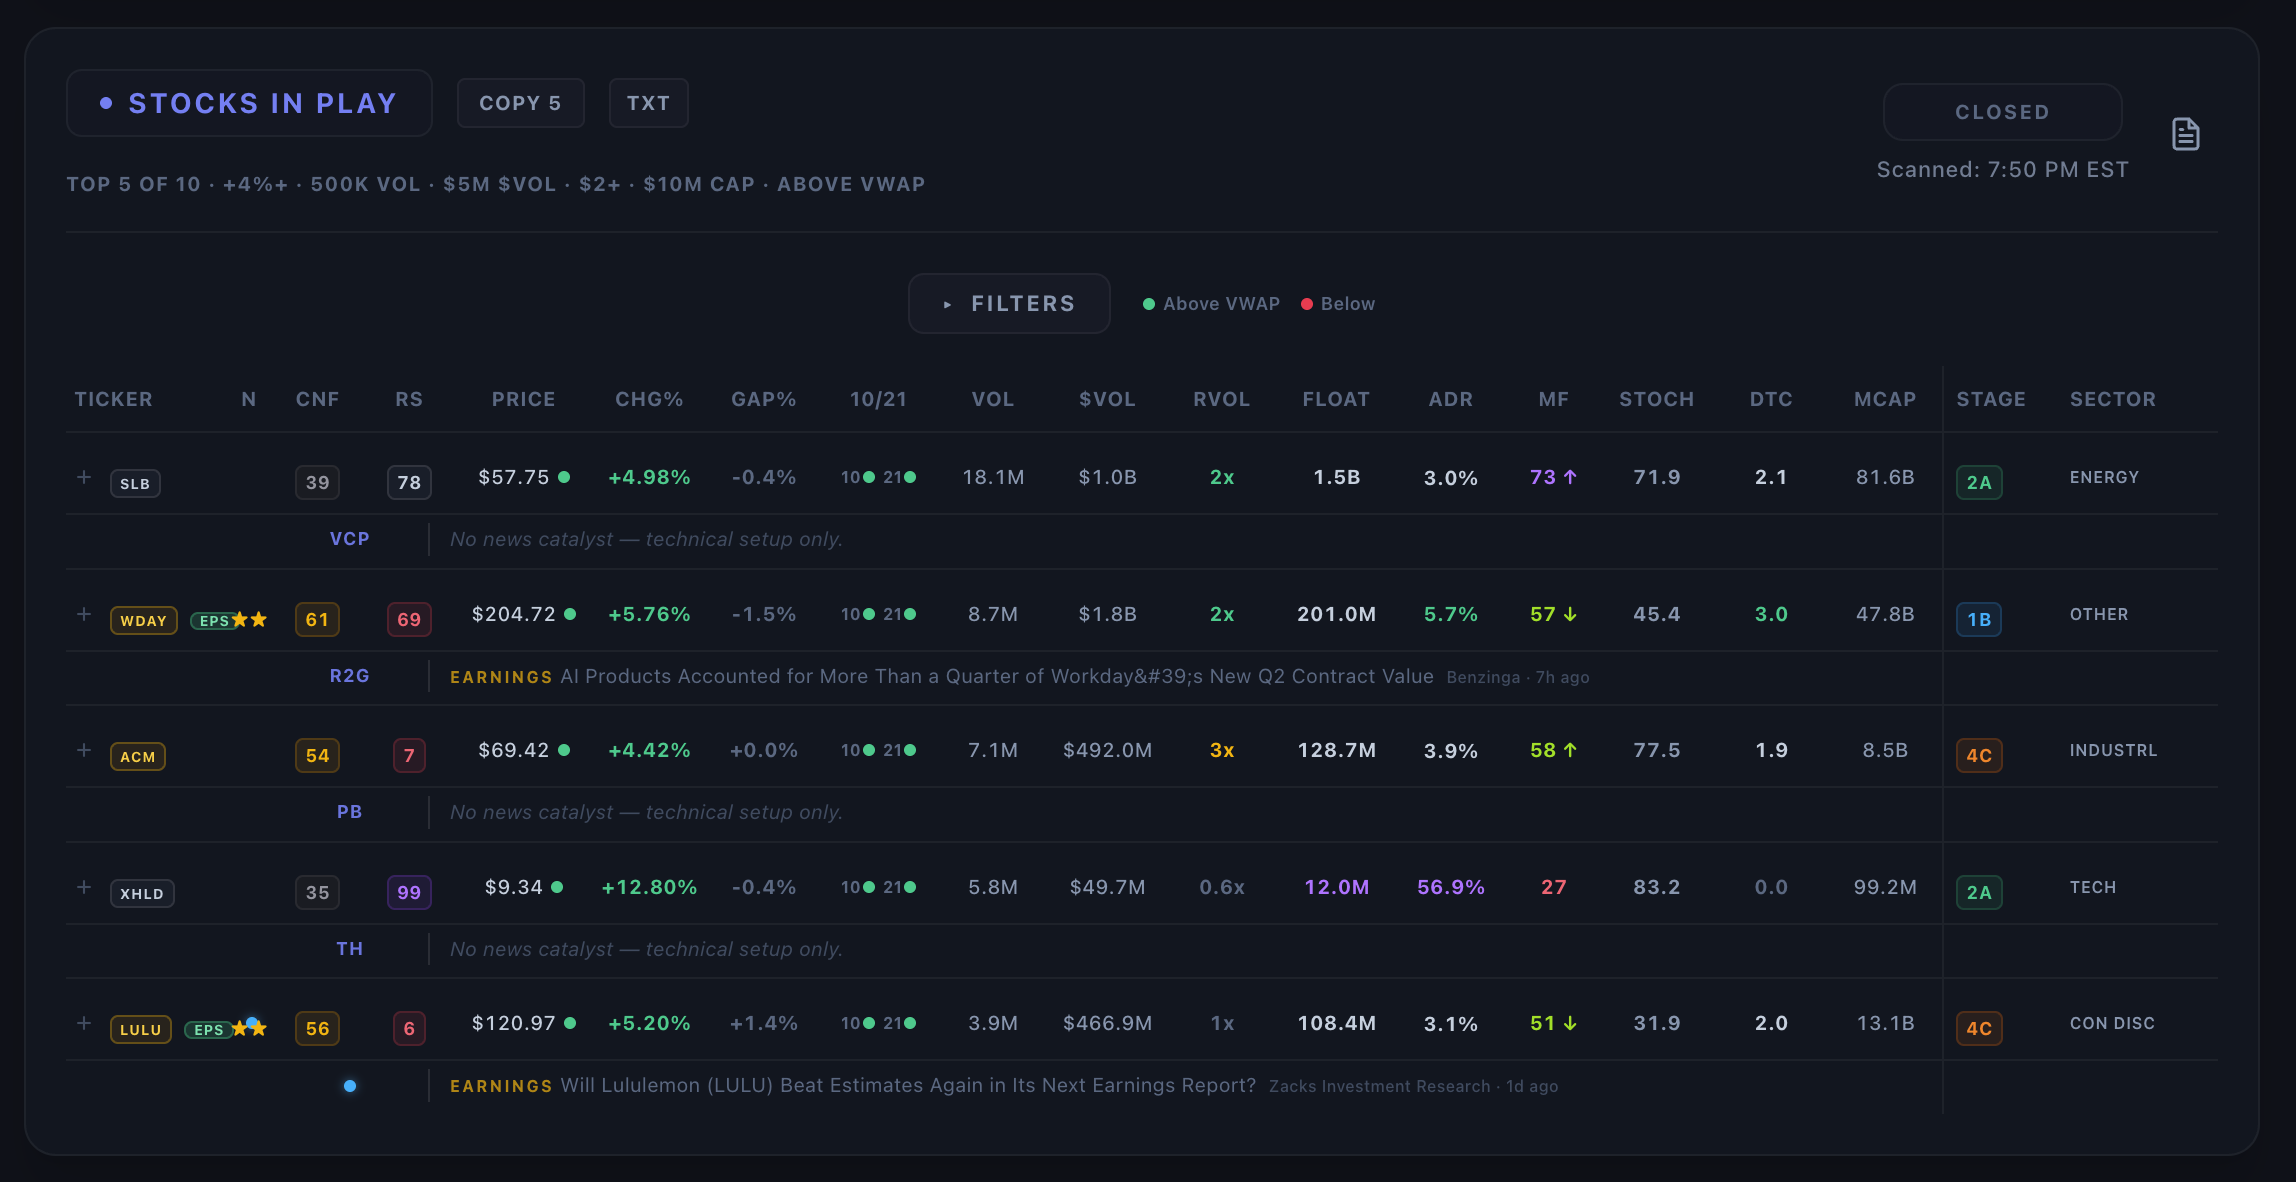
CTT Stocks In Play scanner — top movers with confluence, RS, RVOL, float, money flow, stage, sector, and news catalysts
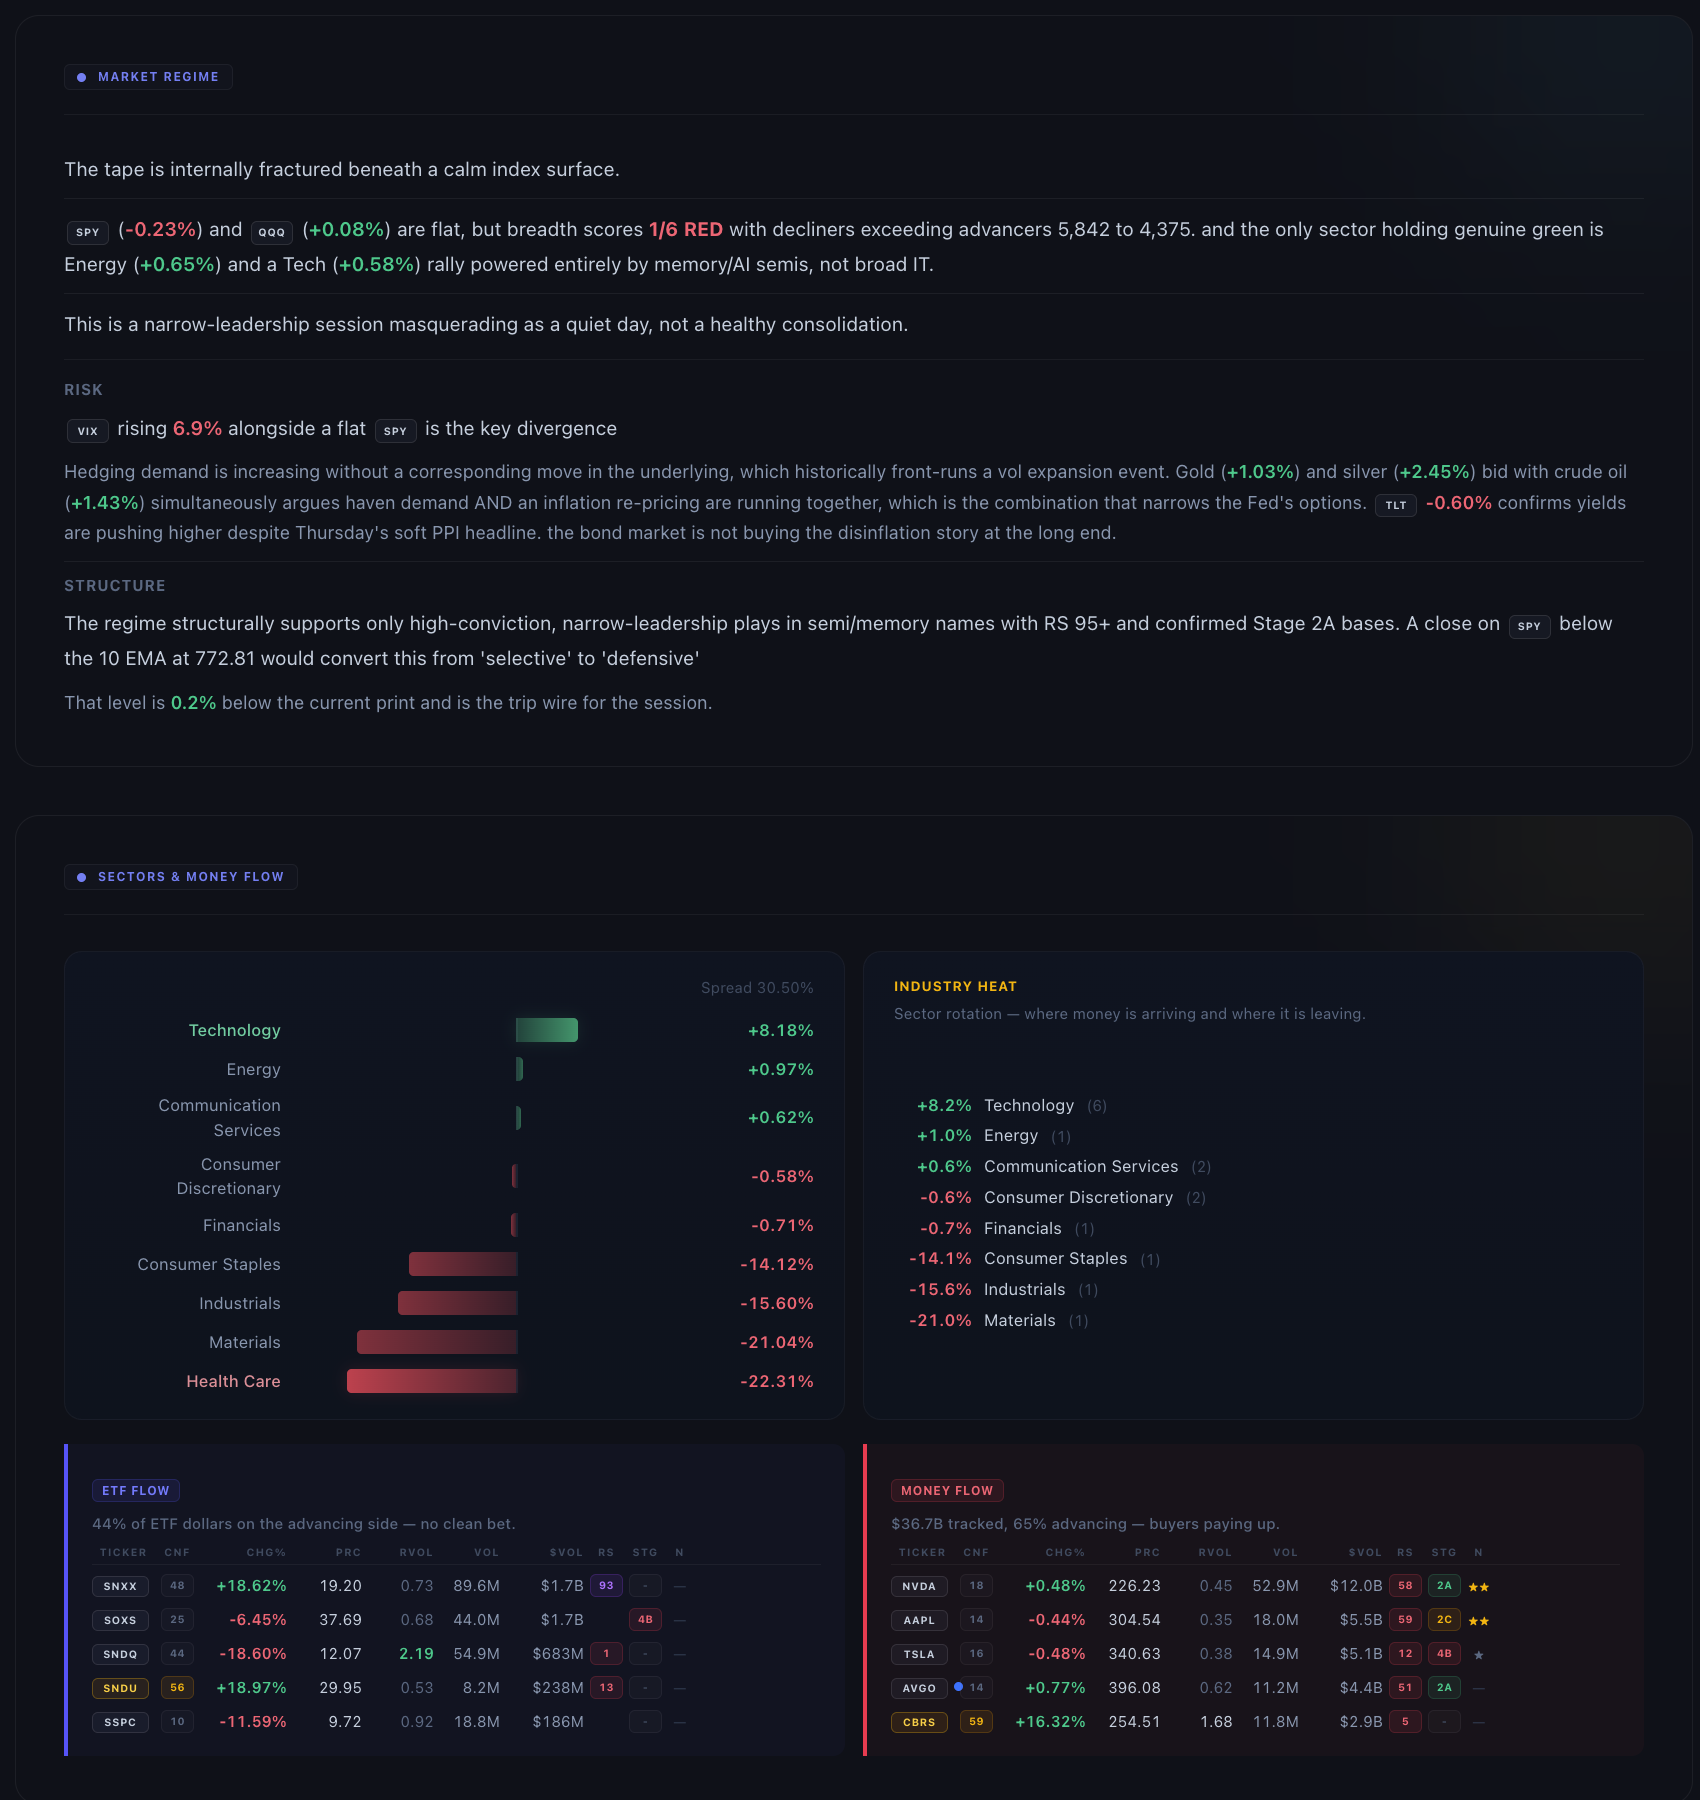
CTT Market Briefing — regime analysis, sector rotation, and money flow
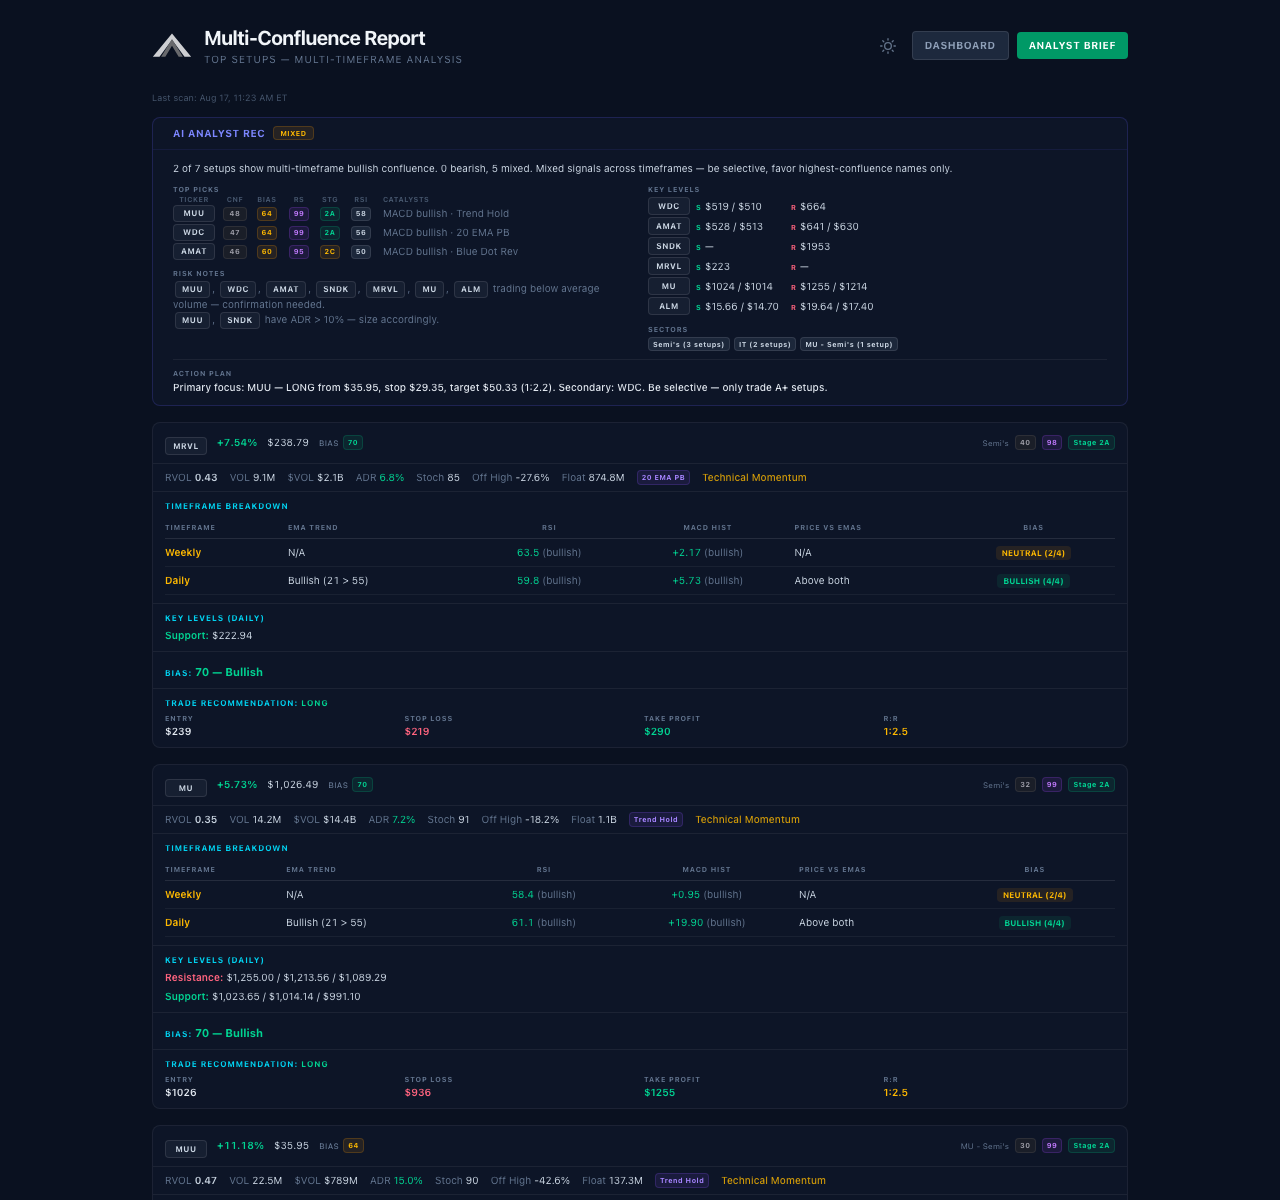
CTT Confluence Report — multi-timeframe analysis with trade recommendations
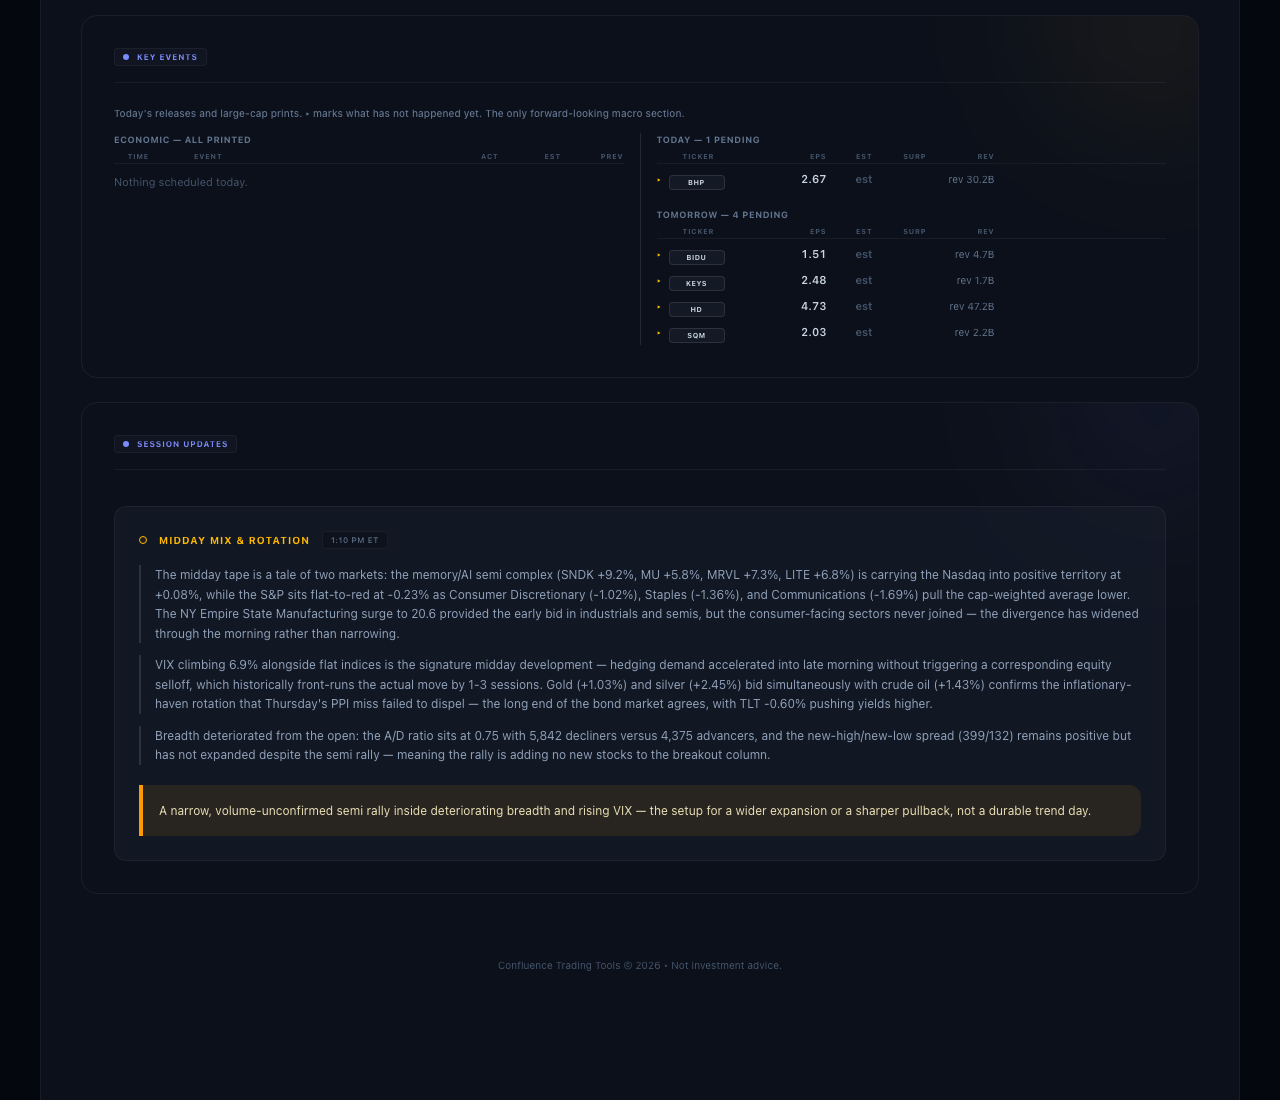
CTT Session Updates — sectors, money flow, top movers, and stocks in play

Everything you need
before the bell

A single workspace that synthesizes market internals, price action, scans, and AI analysis so you can focus on trading, not tab-switching.

Macro Scorecard
Tone, breadth, Institutional Direction, Market Monitor, ADV/DEC internals, ATHI/ATLO new highs/lows, T2108, VIX, and CHOP index with 1D/15M bars and sensitivity controls — all in one glanceable panel.
AI Session Narratives
Claude-powered real-time market narratives that explain what's happening, why, and what to watch for next.
Stock Scanners
10 scanners — daily setups, VCP, swing candidates, EP9M, multibagger, and more — each enriched with live news catalysts and confluence scoring.
Setup Summary
All 11 scanners pooled into one view with quick filters — DAY, SWING, VCP, EP9M, CNF, and more. One stop shop for every setup.
News Catalysts
Benzinga-powered news enrichment across every scanner. Causal filtering separates real catalysts from noise — only headlines that explain the move survive.
Email Briefings
Automated pre-market, morning, midday, and closing email summaries delivered straight to your inbox.

Custom Pine Script
indicators

Four purpose-built TradingView indicators that work standalone or together as a linked suite. Signal generation, dynamic S/R, volatility regimes, and session levels — built for day traders and swing traders.
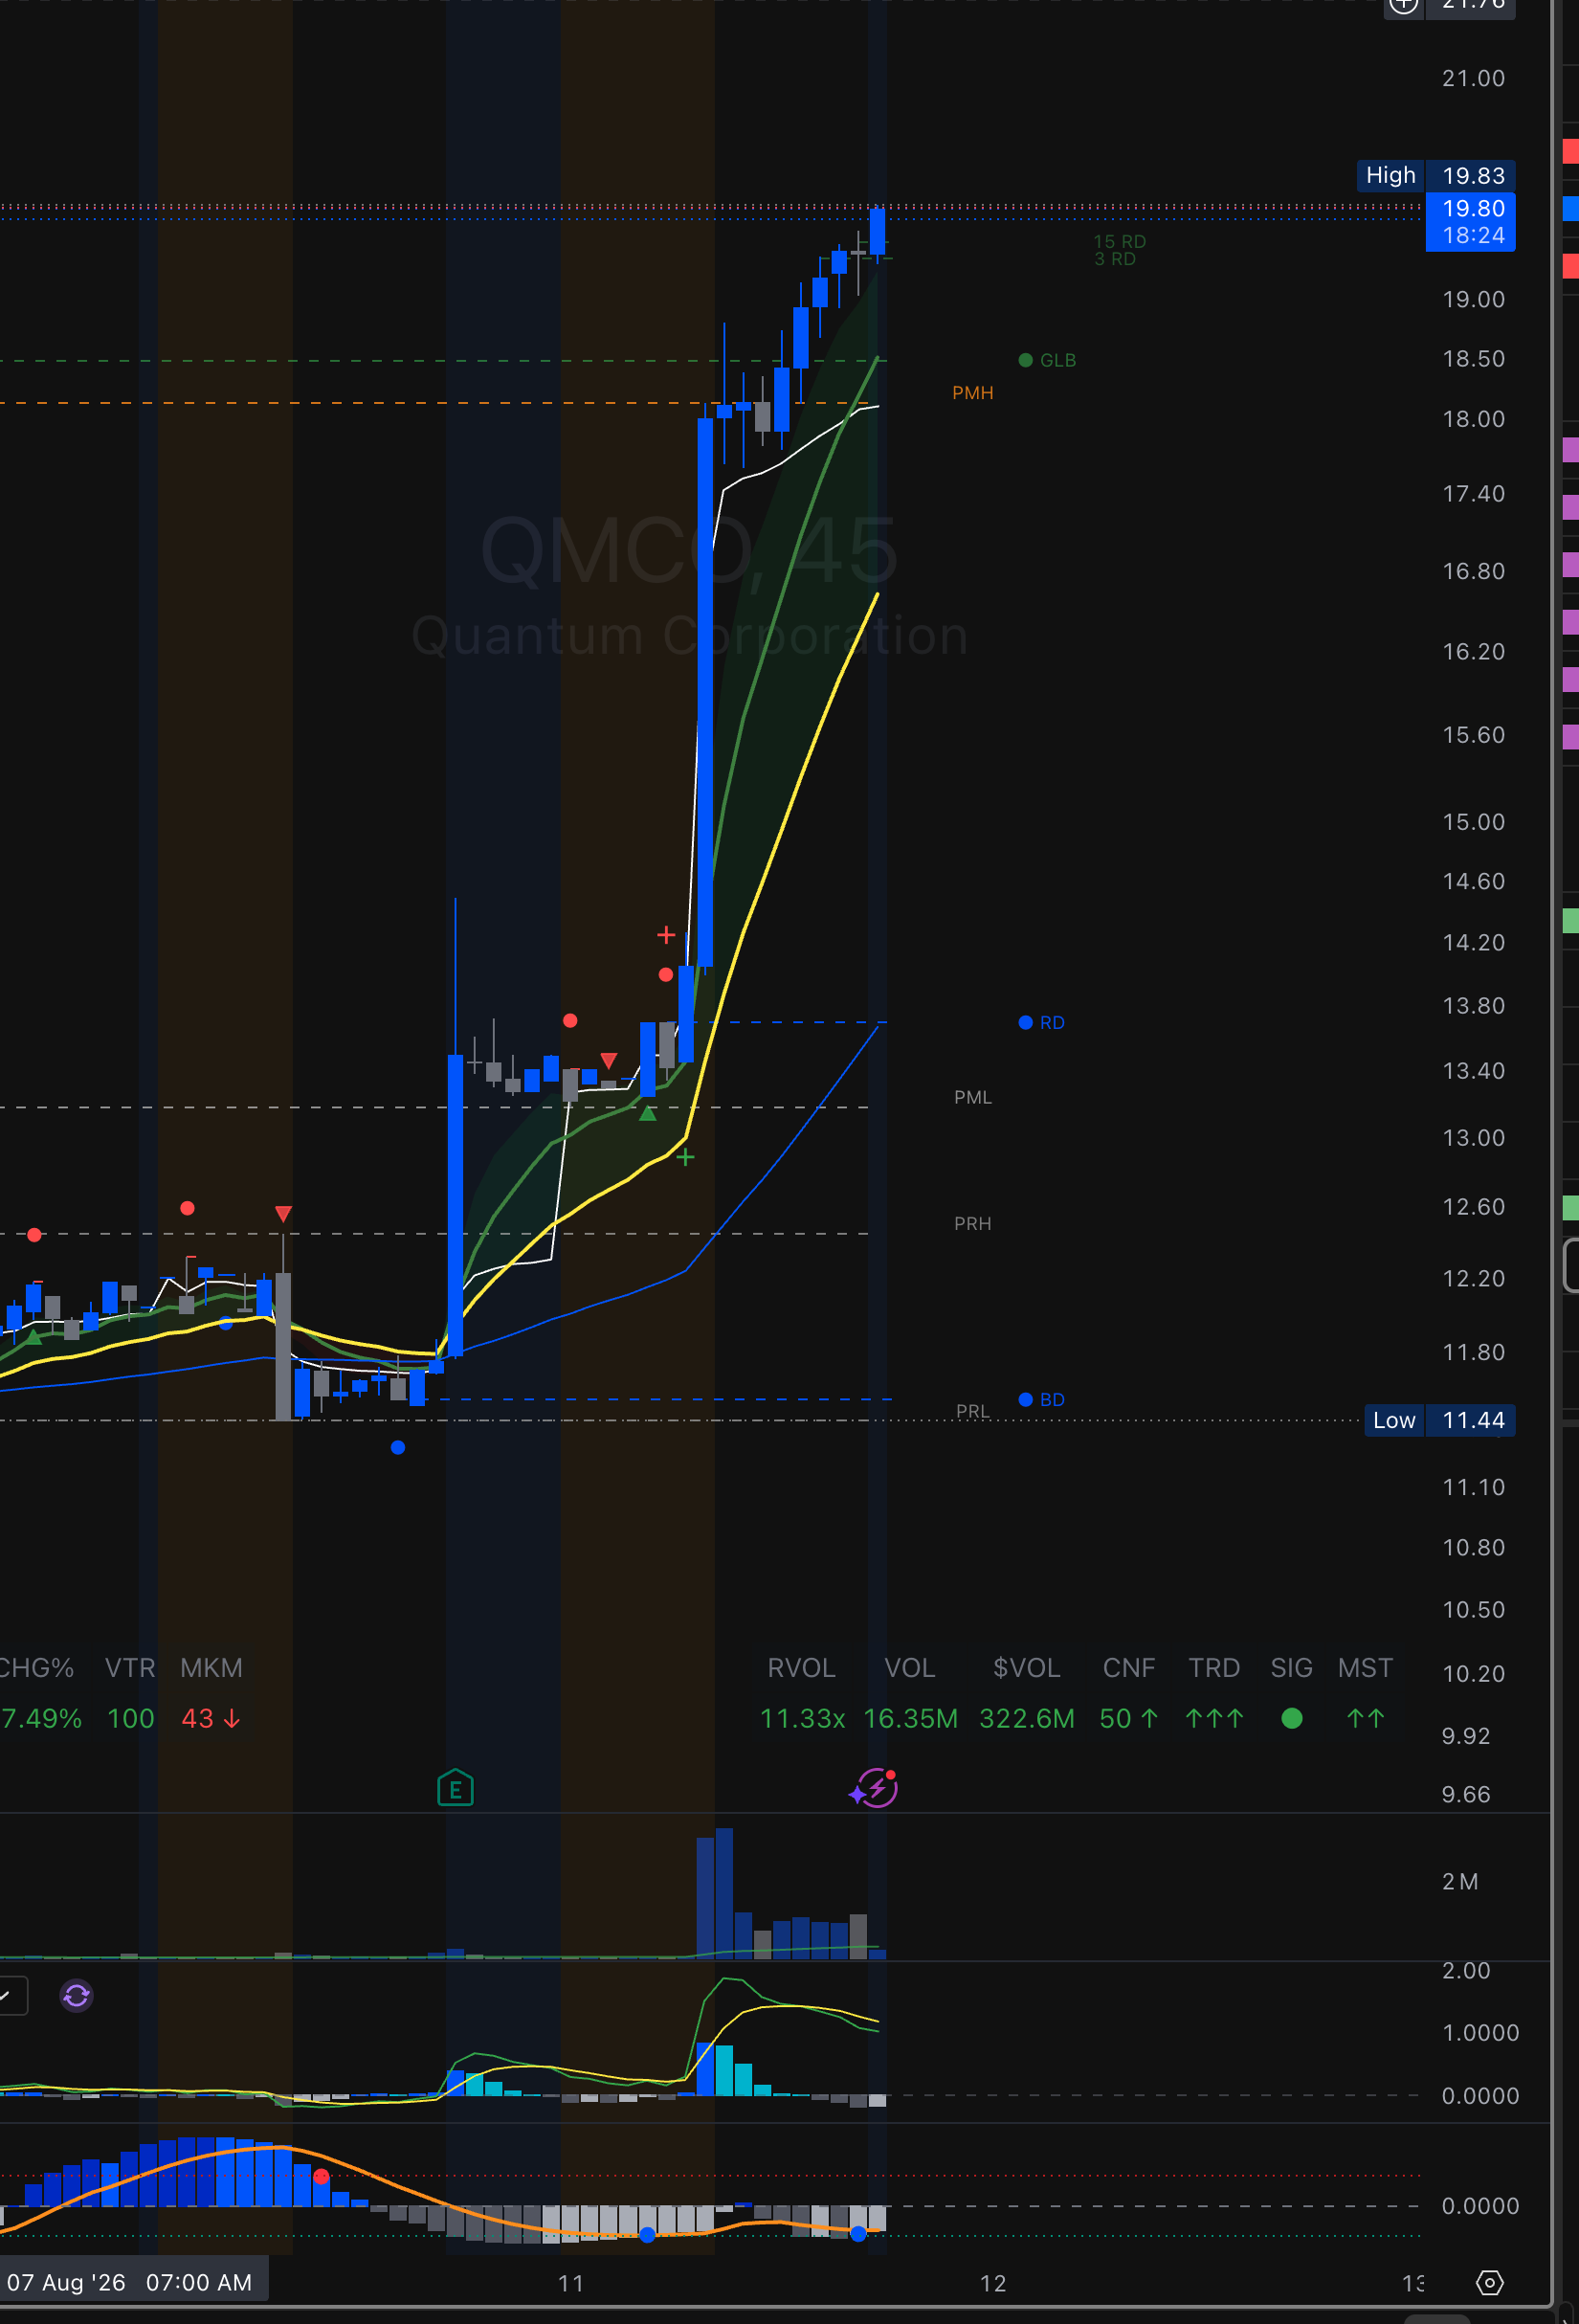
VPCI indicator on mobile showing QMCO 45-min chart with period levels, trend signals, and confluence scoring
Designed for Mobile

Trade anywhere,
miss nothing

Every CTT indicator is optimized for mobile use on the go. Full signal dashboards, period levels, trend detection, and confluence scoring — all readable at a glance on your phone.
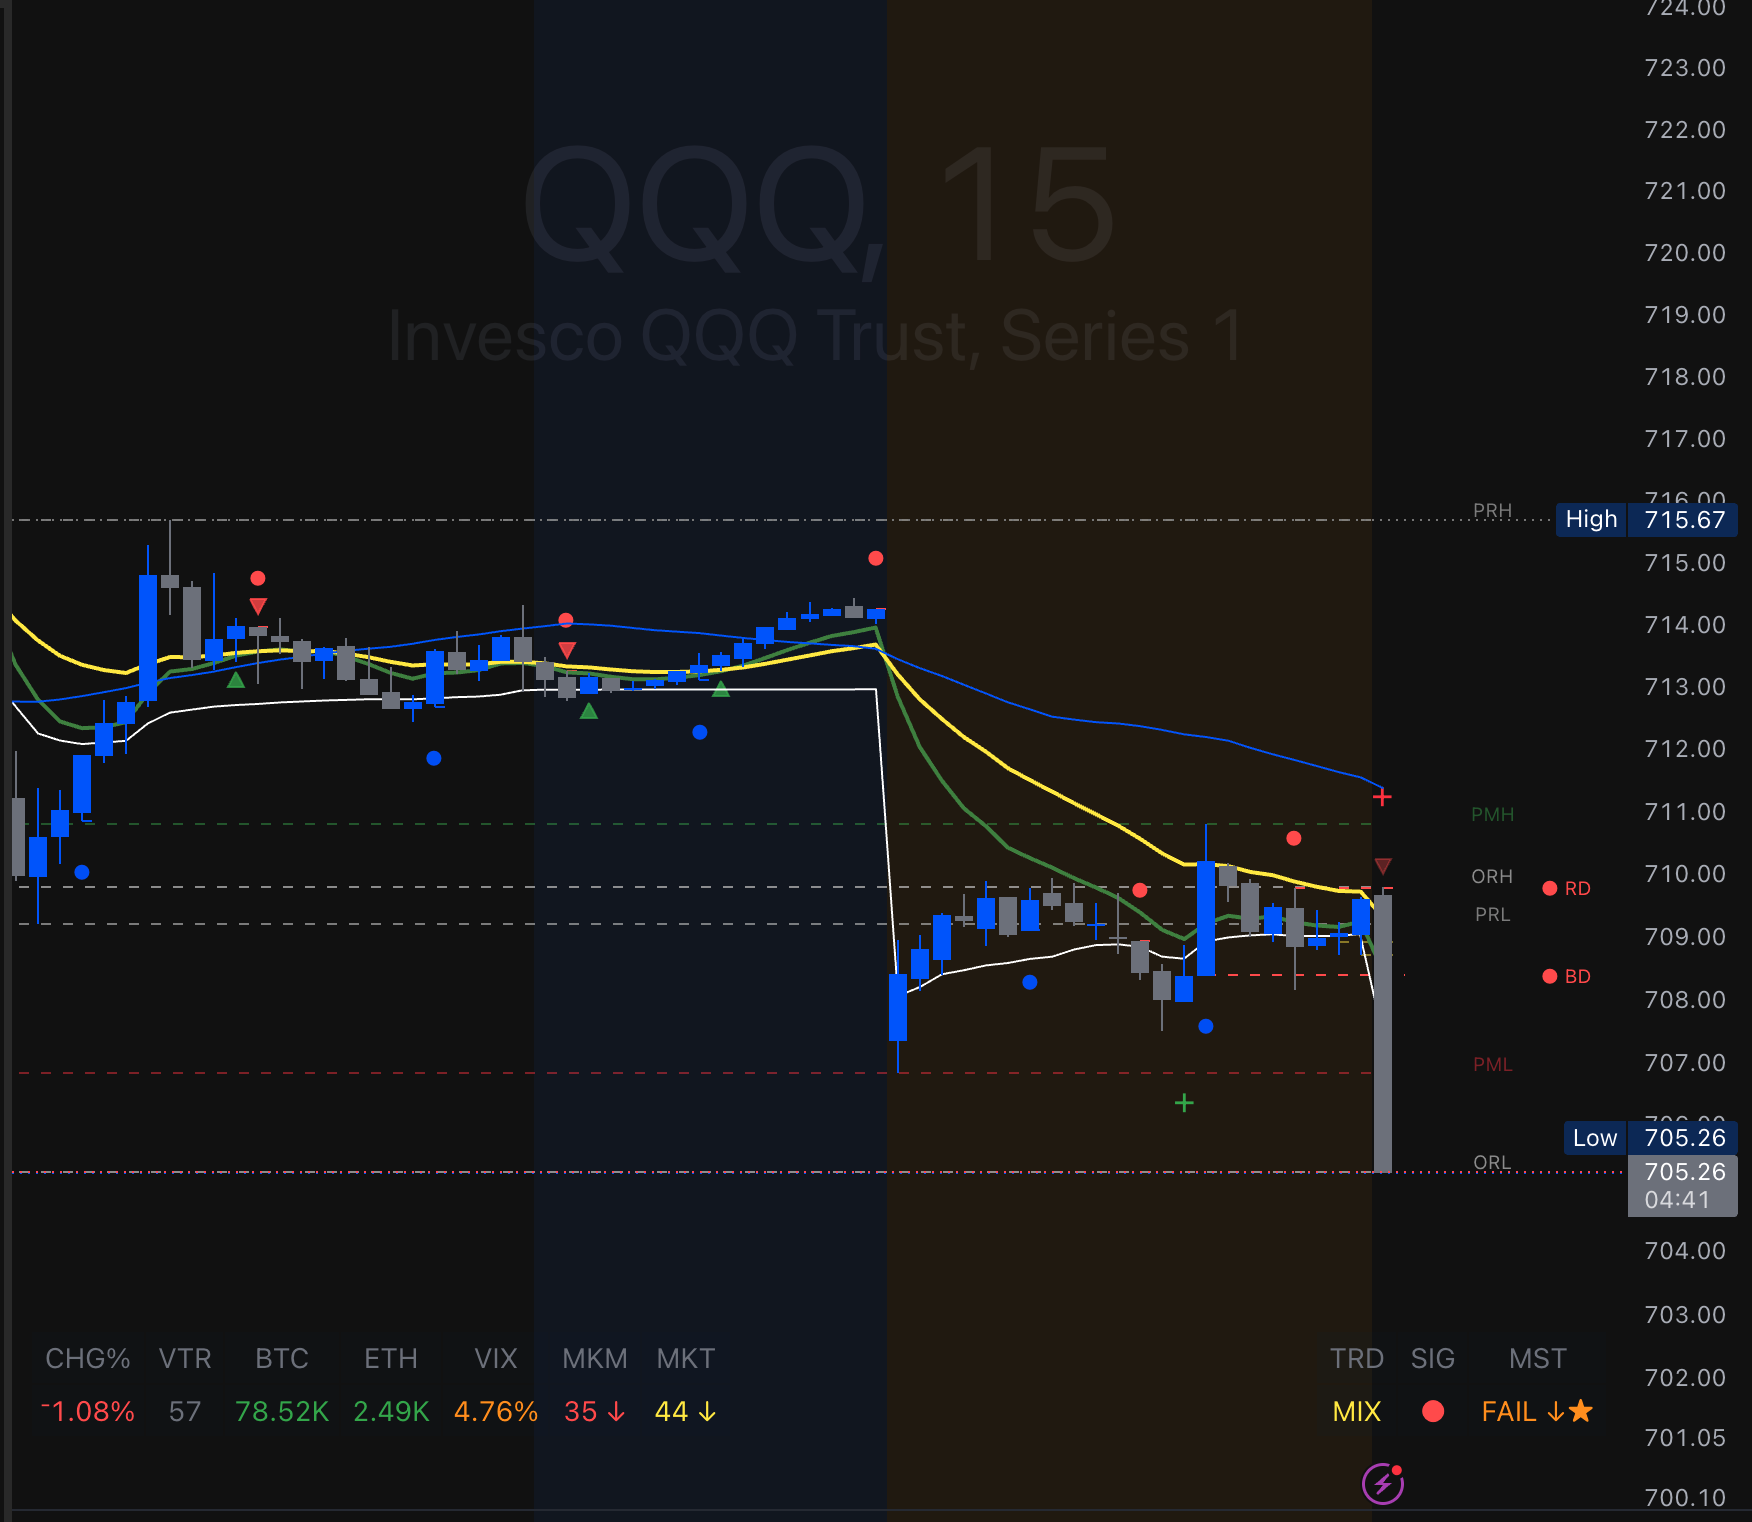
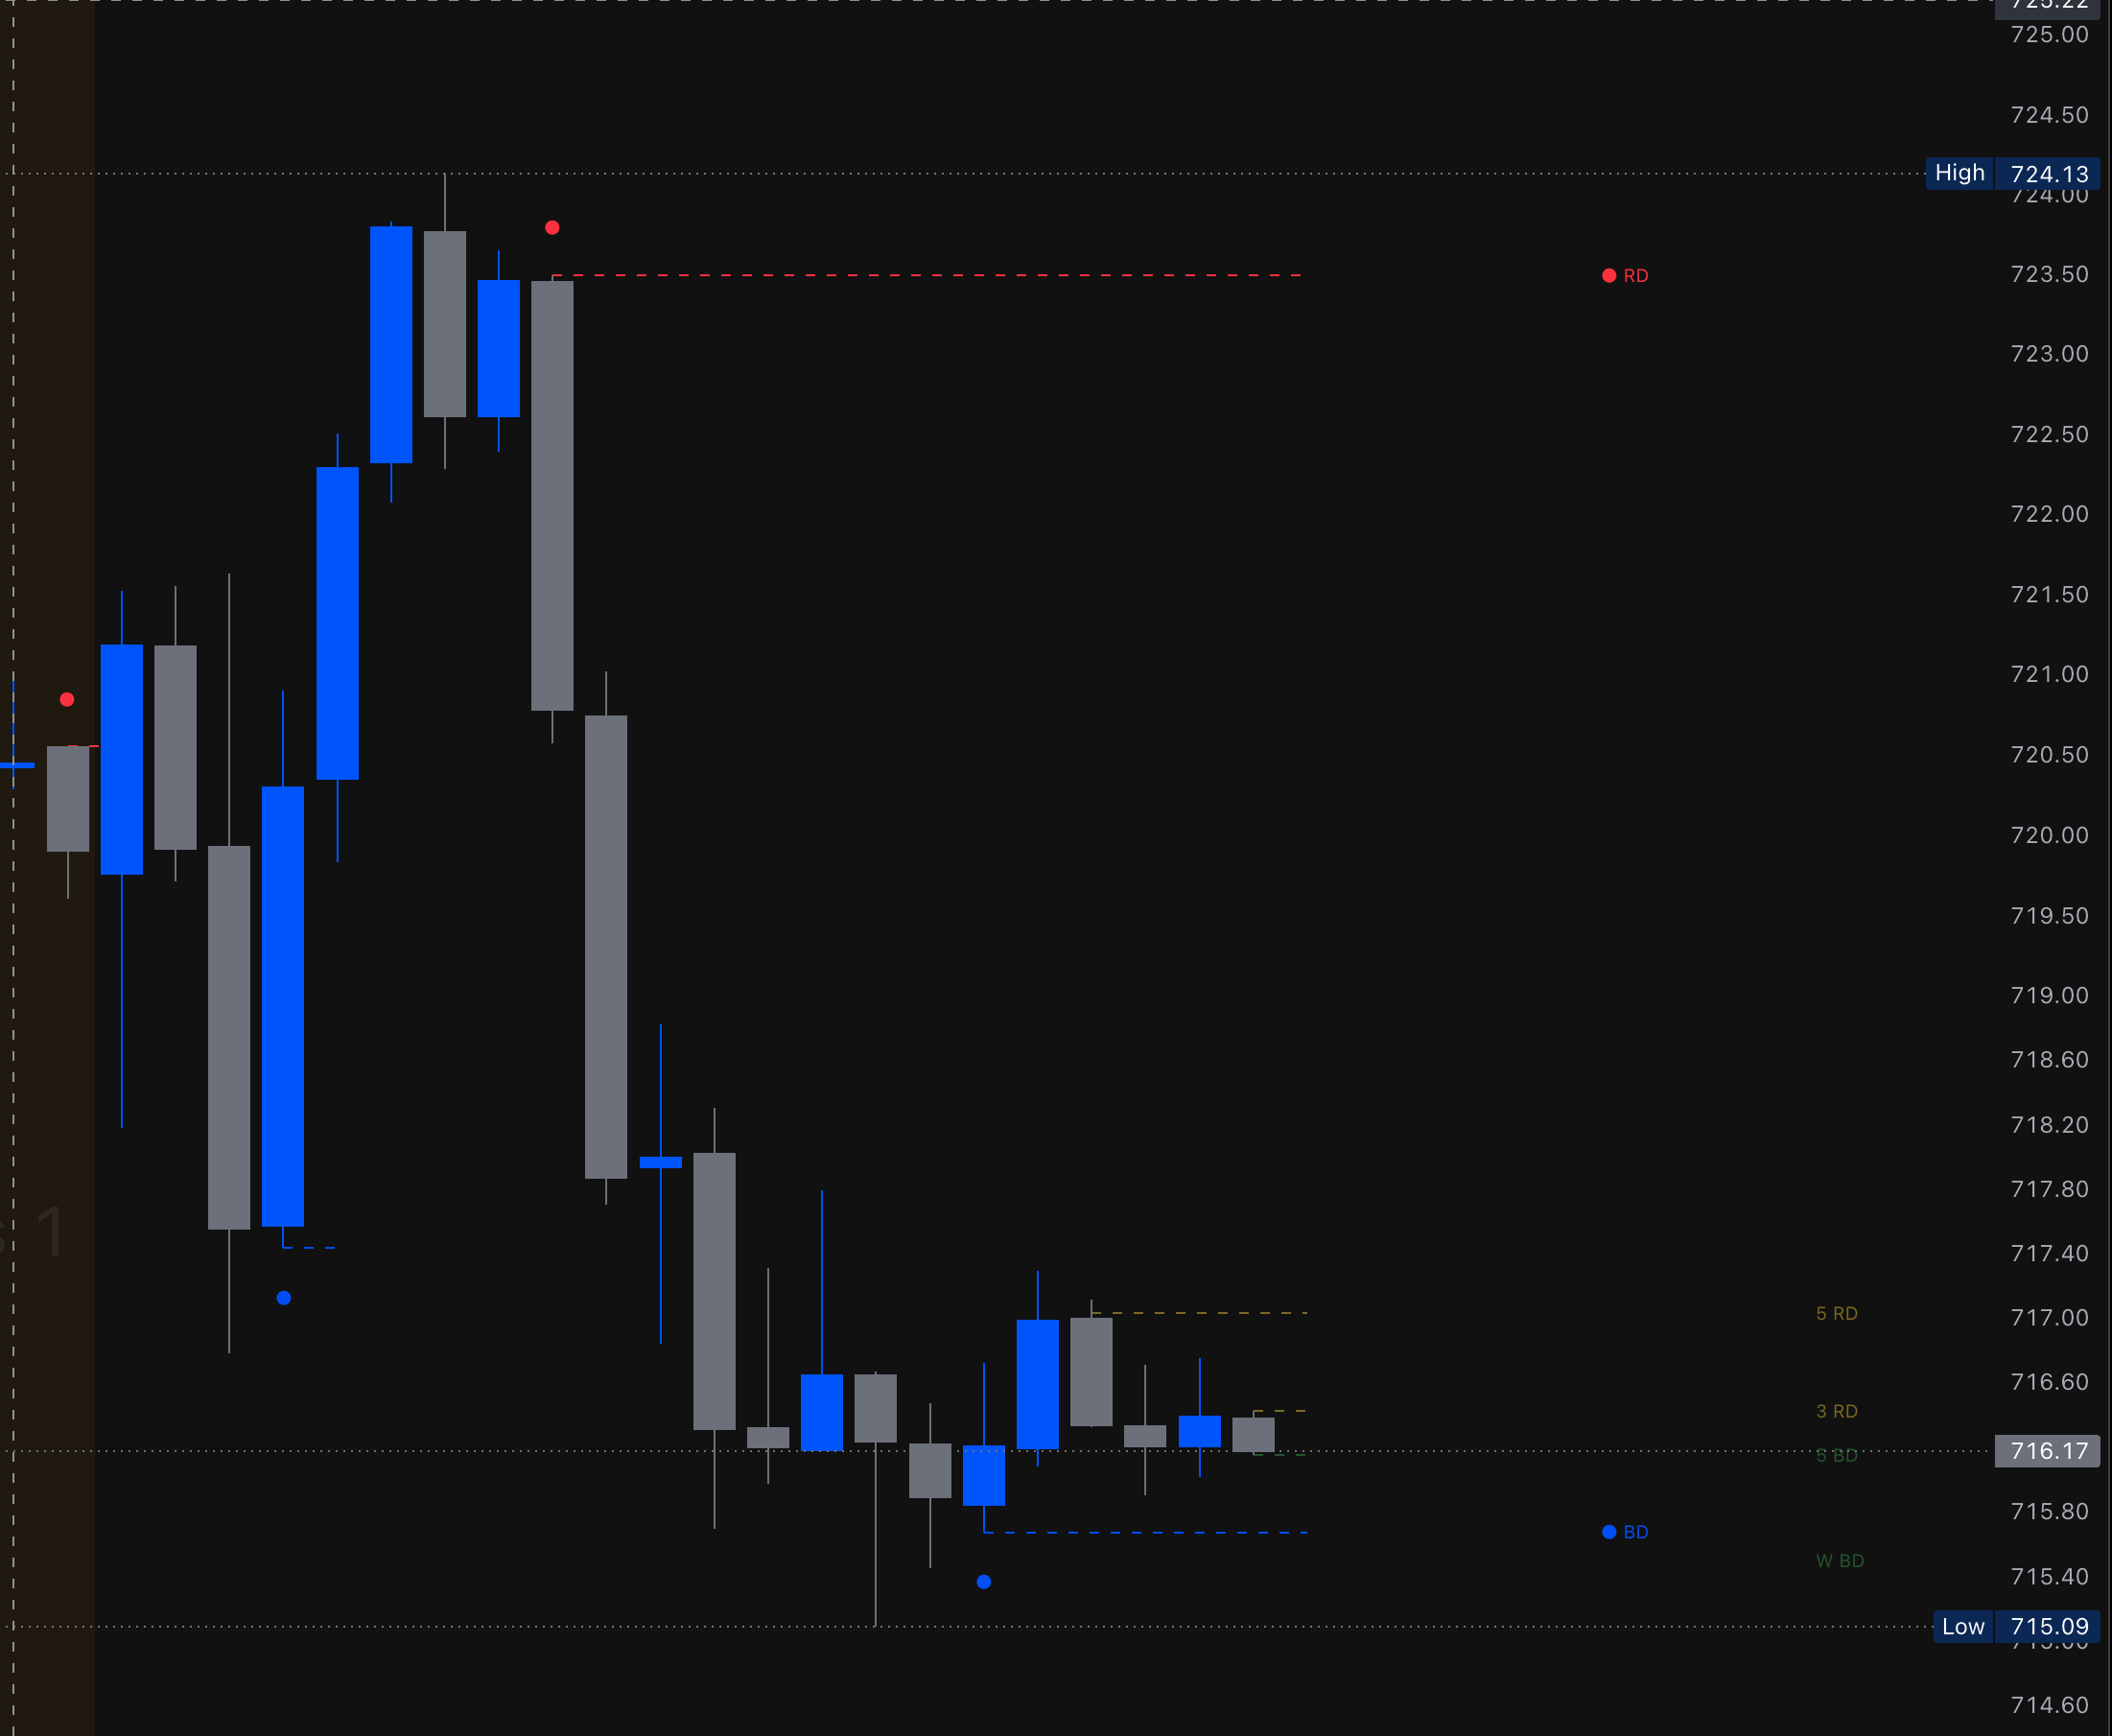
Mobile-optimized signal tables & overlays
Real-time alerts straight to your device
Glanceable confluence scores at any size
VPCI
Overlay
All-in-one overlay with 13 setup engines, Master Signal Table, confluence scoring, trading profiles, squeeze countdown, RVOL, money flow, and Weinstein stage analysis. The brain of the CTT suite.
13 Setup Engines Trading Profiles Confluence Score Signal Quality Gates
VPCI indicator showing signal dashboard, MST, and confluence scoring on a TradingView chart
View on TradingView →
BDRD Full
Overlay
Dynamic multi-timeframe support and resistance using Stochastic Bollinger Band crossovers. Levels auto-update, flip color on price crosses, and cluster when multiple timeframes align at the same price.
Dynamic S/R 7 MTF Slots GLB Breakout VPCI Companion
BDRD Full indicator showing dynamic buy dot and red dot levels with multi-timeframe S/R
View on TradingView →
RMVE
Oscillator
Dual-purpose oscillator combining volatility regime detection (squeeze/normal/expansion) with price extension analysis. Know when a squeeze is building and whether price is overbought or oversold relative to its historical range.
Squeeze Detection Extension Oscillator Depth Rating VPCI Companion
RMVE oscillator showing volatility regime detection with squeeze rating and extension levels
View on TradingView →
OR & Period Levels
Overlay
Clean overlay plotting Opening Range High/Low, Previous Day High/Low, and Pre-Market High/Low with built-in opening momentum breakout detection. Six levels, one indicator, zero clutter.
Opening Range PDH/PDL Pre-Market Levels Momentum Setup
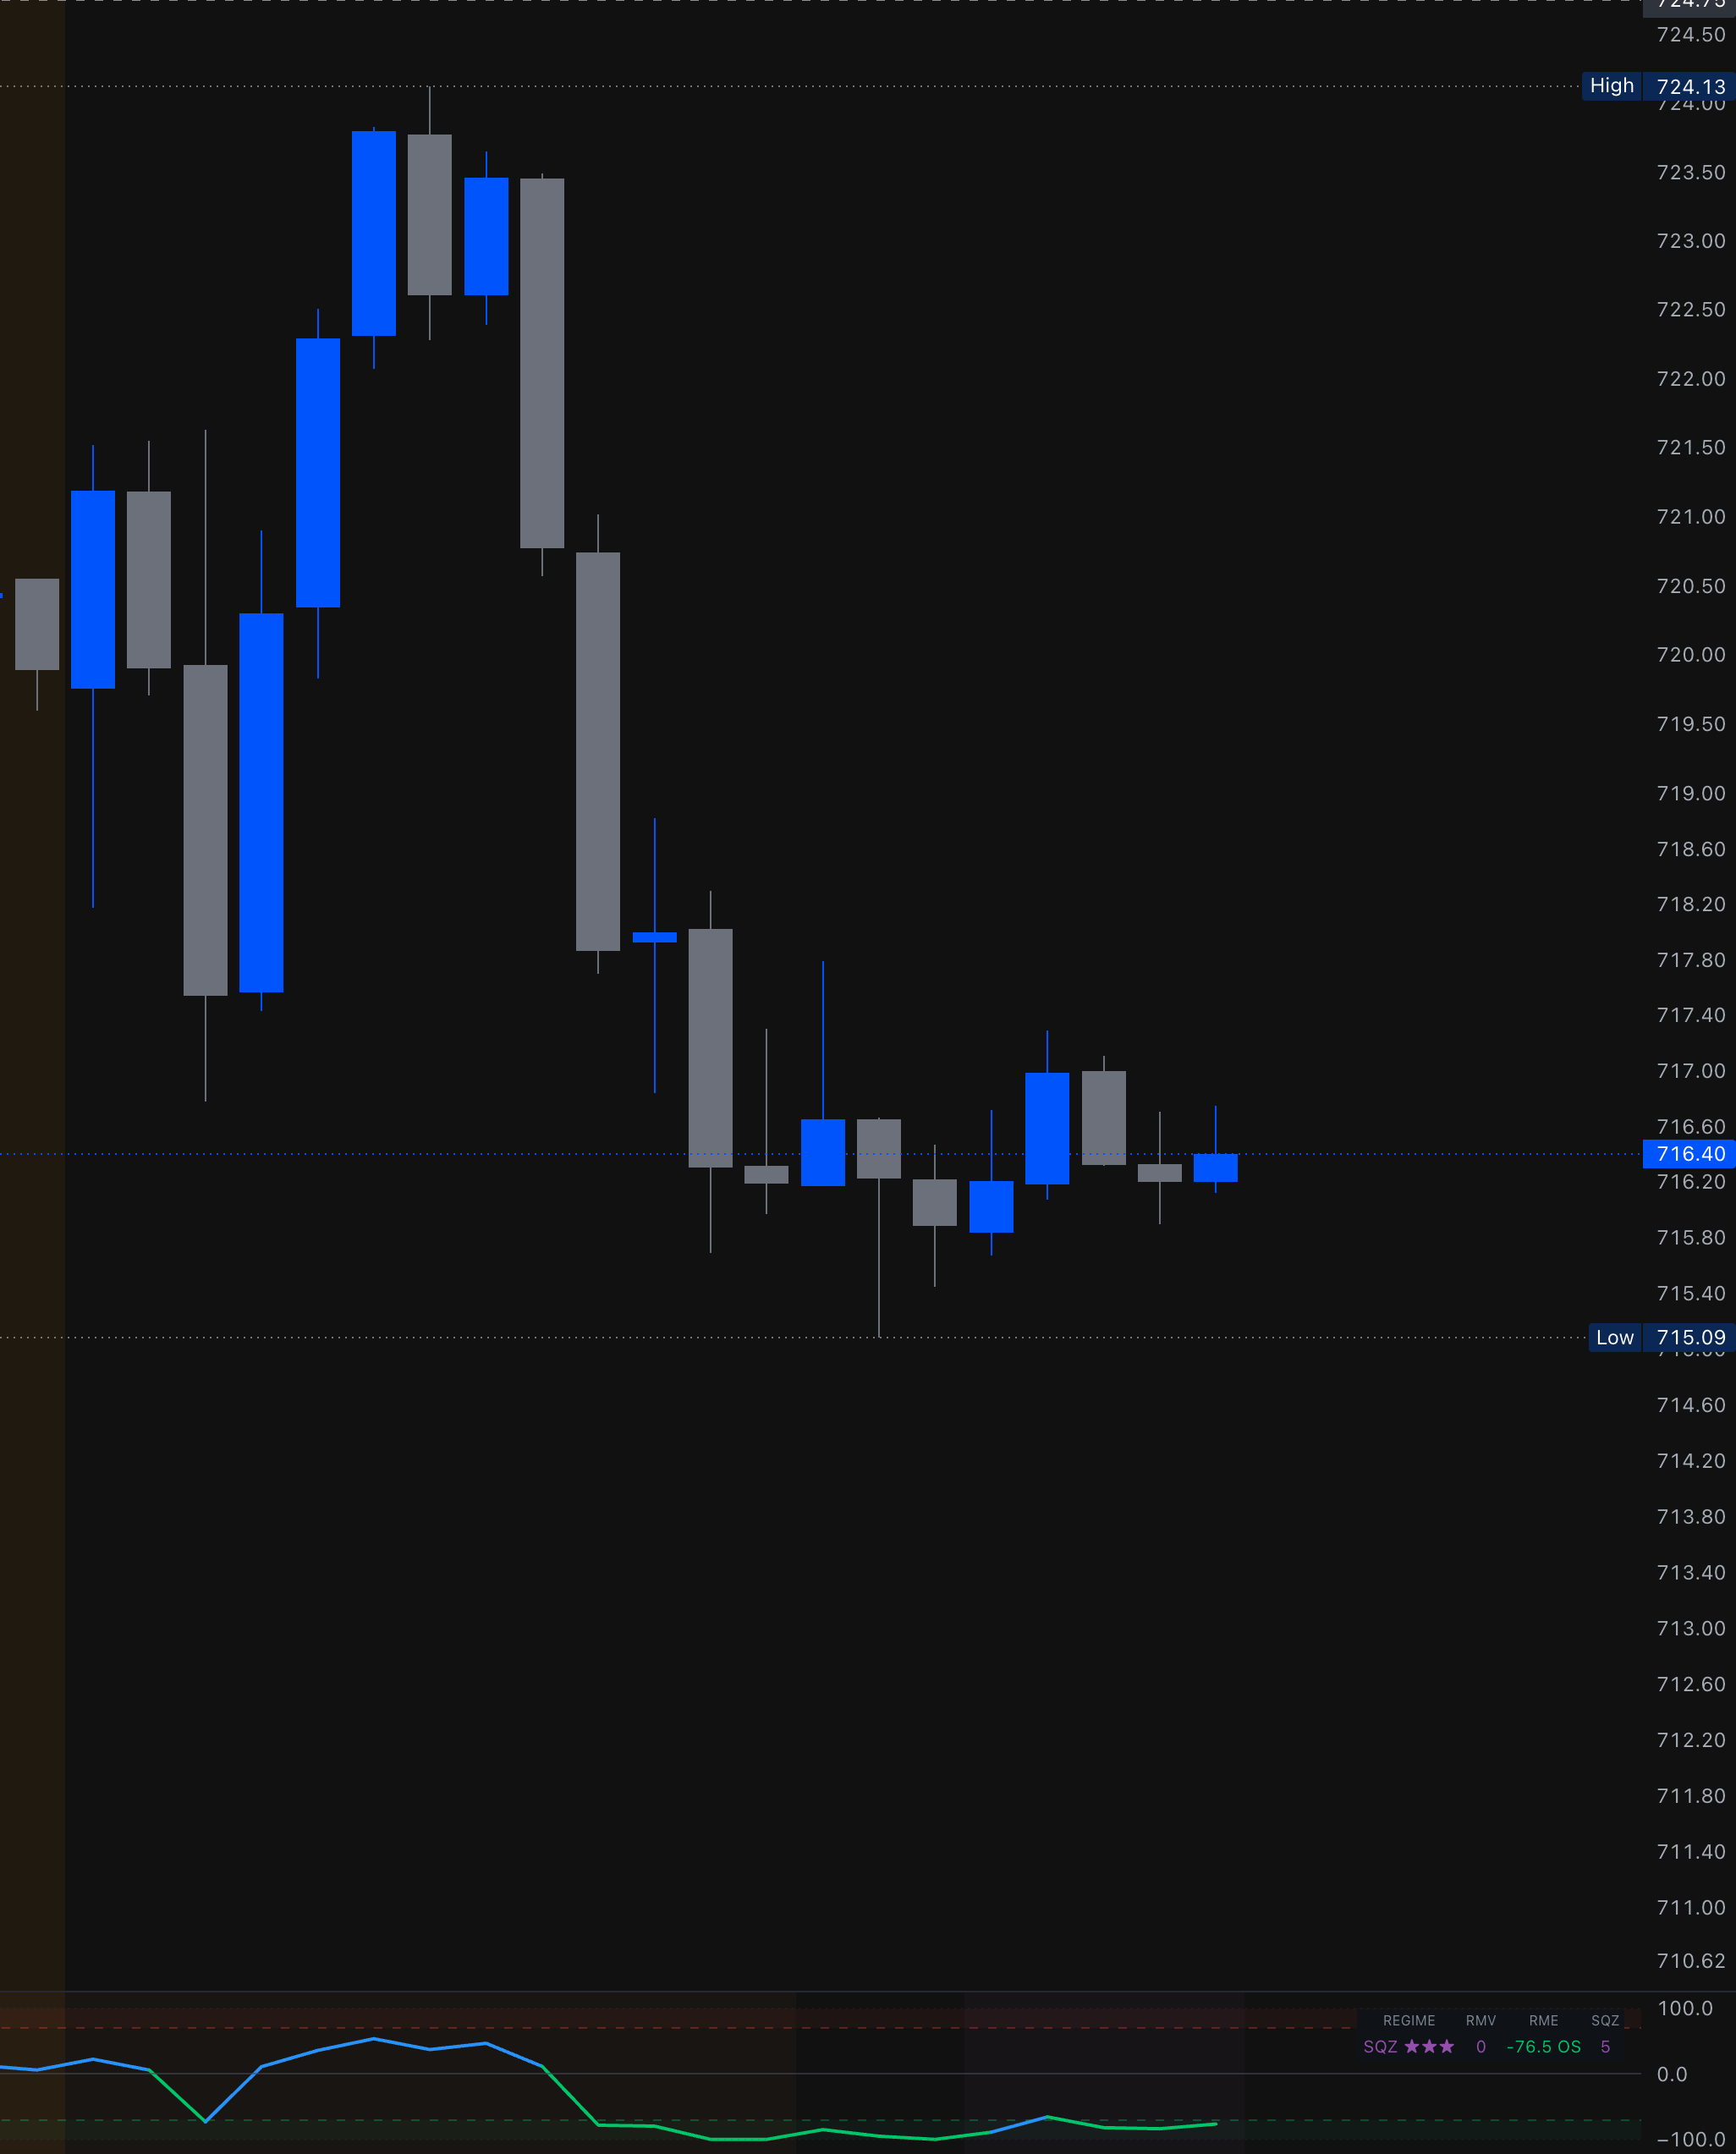
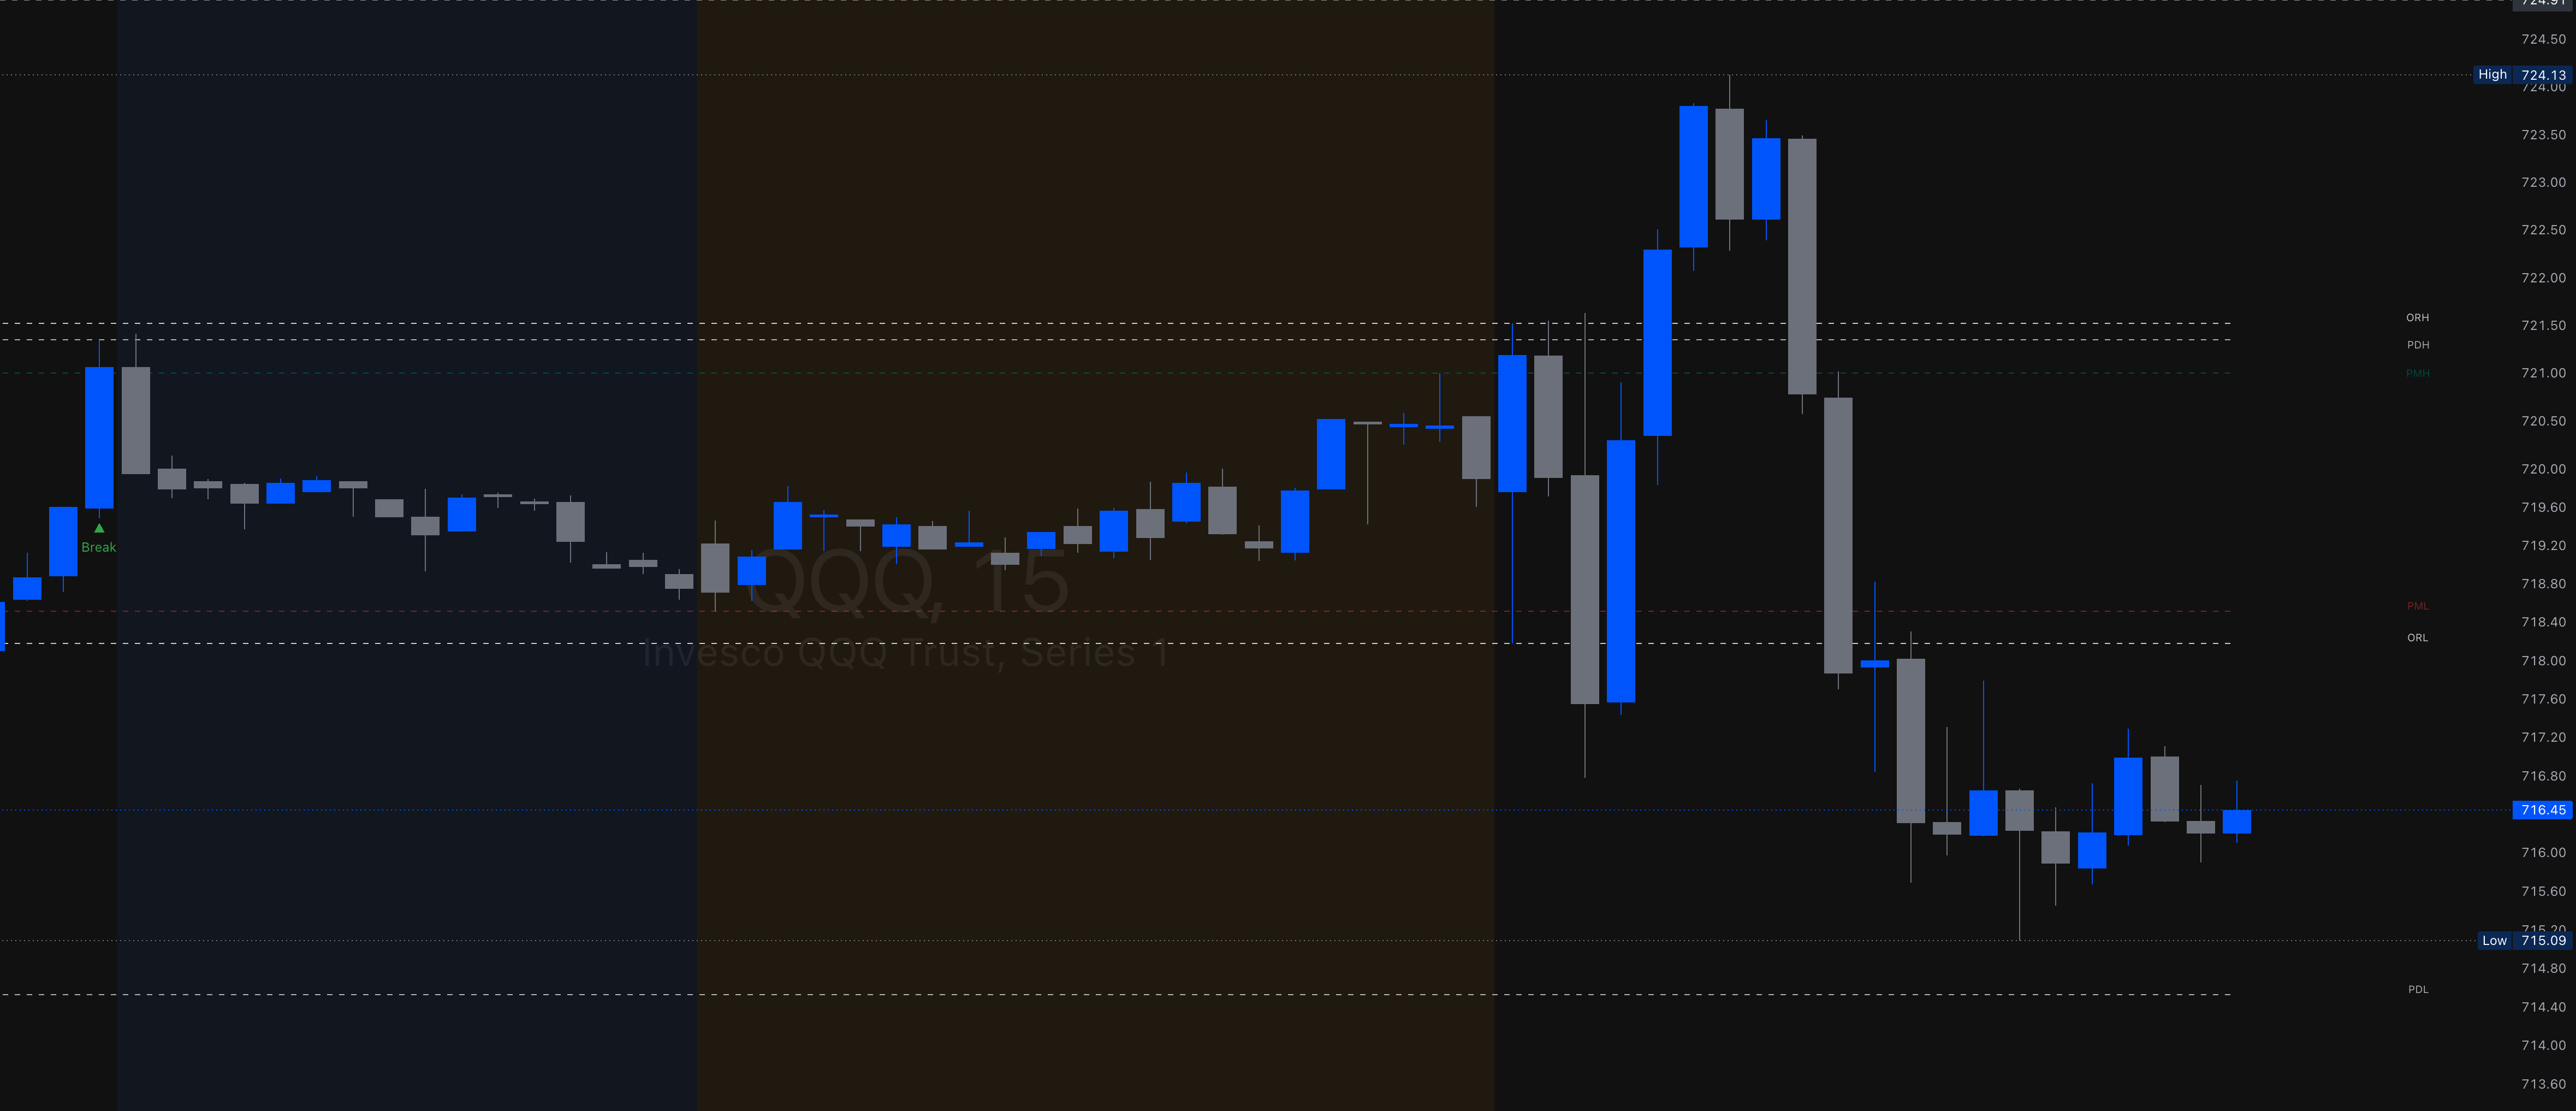
OR & Period Levels showing opening range, previous day, and pre-market levels on intraday chart
View on TradingView →
Built to Work Together

All four indicators work standalone, but they become more powerful when linked. BDRD and RMVE publish companion signals that VPCI consumes through TradingView's source linking — adding dynamic S/R bias and volatility regime data to VPCI's confluence score and signal quality ratings. Connect them once and they stay linked.

Get All 4 Indicators — $14.99/mo 7-day free trial · Cancel anytime · Instant TradingView access

Free Indicators

Open-source tools — add them to any TradingView chart, no account required.

MACD + Over
Overlay
Lightweight MACD crossover overlay that plots bullish and bearish cross signals directly on the price chart. Green markers below bars on bullish crosses, red markers above on bearish — no separate pane needed.
Bullish/Bearish Crosses On-Chart Signals Configurable Lengths
View on TradingView →
Position Calculator
Overlay
Risk-based position sizing on the chart. Enter your account size and risk percentage, set a stop loss (manual or ATR-based), and get exact share count with R-multiple profit targets drawn directly on price.
ATR Stop Loss R-Multiple Targets Max Position Cap
View on TradingView →
Market Breadth Momentum
Oscillator
Breadth-derived momentum oscillator tracking new highs vs new lows across the market. Gauges broad participation strength with fast/slow crossover system — bullish above 60, bearish below 40.
Breadth Analysis Momentum Score Fast/Slow Crossover
View on TradingView →

Want to be a Founder?

Get early access and help shape the platform from day one. Join the founding members list.

You're on the list!